Visceral fat does not look like anything — because it sits inside the abdominal cavity, wrapped around your organs, completely invisible from the surface. You cannot see it in the mirror. A progress photo will not reveal it. A standard body fat scale will not measure it accurately.
What you can observe are the signals it creates: a specific belly shape, a specific belly texture, and a specific fat distribution pattern that differs meaningfully from subcutaneous fat. Understanding what those signals mean — and which ones are reliable — is what this article covers.
The Hard Belly Signal
The most commonly searched question about visceral fat appearance is some version of "why is my belly hard?" Hard belly and soft belly feel different for a reason rooted in anatomy.
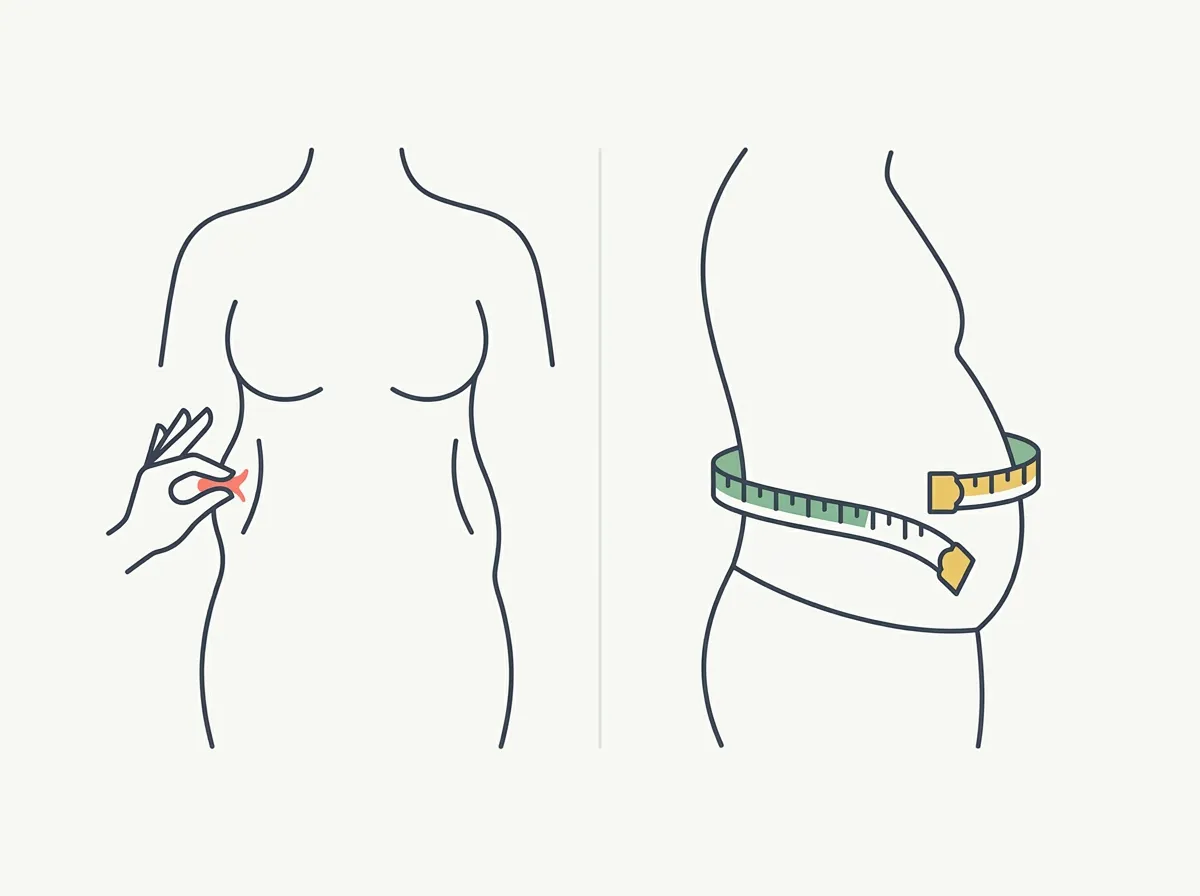
Subcutaneous fat sits between your skin and your abdominal muscles. It is the fat you can pinch. It jiggles when you move. A belly that protrudes but feels soft and pliable is primarily subcutaneous.
Visceral fat sits behind the abdominal muscles, inside the peritoneal cavity. Because the abdominal wall sits in front of it, the visceral fat pushes outward against that wall. The result is a belly that protrudes but feels firm and relatively unyielding — because what you're feeling is the abdominal wall under pressure, not the fat directly.
This distinction matters clinically because visceral fat is metabolically active in a way subcutaneous fat is not — it secretes inflammatory cytokines and hormones that directly affect cardiovascular risk, insulin sensitivity, and liver function. The belly shape is a proxy for that biology.
Body Shape as a Visceral Fat Signal
Fat distribution patterns are partly sex-driven and partly a function of which fat depot fills first. Visceral fat tends to accumulate centrally — in and around the abdomen — creating what's described as an apple-shaped distribution. Subcutaneous fat accumulates more in the hips, thighs, and lower belly, creating pear-shaped distribution.
| SHAPE SIGNAL | WHAT IT SUGGESTS | RELIABILITY |
|---|---|---|
| Upper abdominal protrusion (above navel) | Higher visceral fat component | Moderate — not definitive |
| Lower belly pouch (below navel) | More subcutaneous-dominant | Moderate |
| Apple shape (waist ≥ hips) | Android fat distribution — visceral risk higher | Good — validated by epidemiology |
| Pear shape (hips > waist) | Gynoid fat distribution — visceral risk lower | Good |
| Hard, protrudes but not pinchable | Visceral pressure on abdominal wall | Good qualitative signal |
| Soft, jiggles, pinchable | Predominantly subcutaneous | Good qualitative signal |
None of these shape signals are definitive measurements. They are qualitative indicators that, combined, give you a reasonable picture. Someone who is apple-shaped with a firm belly protrusion above the navel has a meaningfully different risk profile than someone who carries most of their fat in the hips and thighs — even at identical body weight.
Waist Circumference: The Best Non-Imaging Proxy
Waist circumference is the single most useful measurement you can take at home for estimating visceral fat load. It is used in clinical practice precisely because it correlates more strongly with visceral fat volume than total body weight or BMI does.
| THRESHOLD | MEN | WOMEN | SOURCE |
|---|---|---|---|
| Elevated risk | >40 in (102 cm) | >35 in (88 cm) | American Heart Association |
| High risk | >43 in (109 cm) | >37 in (94 cm) | IDF / WHO |
How to measure correctly: Stand relaxed (don't suck in). Find the midpoint between your lowest rib and the top of your hip bone — that's where to measure, roughly at navel height or slightly above. Exhale normally. Take the measurement at the same point each time, at the same time of day (morning, before eating, is most consistent).
Waist-to-hip ratio adds another layer: divide waist circumference by hip circumference. A ratio above 0.90 in men or 0.85 in women is associated with elevated visceral fat risk in research populations. The ratio matters because it captures relative fat distribution — a person with wide hips and a wide waist has a different risk profile than someone with the same waist measurement and narrow hips.
How to Tell If You Have Visceral Fat: What the Signals Mean Together
No single observable signal confirms elevated visceral fat. But several signals together build a consistent picture. Here is how each one layers:
Press your palm flat against your abdomen and apply firm pressure. A belly that resists and feels taut is exerting outward pressure from within. A belly that compresses easily is predominantly subcutaneous.
Measure at the same point monthly. Track the trend, not the single reading. A waist circumference decreasing over months — even when weight on the scale hasn't moved — is a reliable indicator of visceral fat reduction.
Visceral fat often responds to caloric deficit and exercise before subcutaneous fat becomes visibly reduced. Trousers fitting looser around the waist before you see mirror changes is a common — and real — pattern. Your body is changing before your photos show it.
Apple vs pear. Upper belly vs lower belly. Waist-to-hip ratio above or below threshold. These shape characteristics are not precise measurements but they provide consistent context when tracked over months.
Measurement Methods Compared
| METHOD | WHAT IT MEASURES | VISCERAL FAT ACCURACY | COST |
|---|---|---|---|
| CT scan | Direct visceral fat volume (cross-sectional area) | Gold standard | $$$$ — medical setting |
| MRI | Direct visceral fat volume | Gold standard | $$$$ — medical setting |
| DEXA scan | Android fat mass (abdominal region) | Strong proxy — correlates closely with visceral | $50–$150 per scan |
| Waist circumference | Abdominal girth — surface proxy | Good — AHA-validated thresholds | Free |
| Waist-to-hip ratio | Fat distribution pattern | Good — validated in epidemiological studies | Free |
| BIA smart scale | Derived "visceral fat rating" (indirect) | Moderate — heavily hydration-sensitive | $50–$200 device |
| AI photo app | BF% and subcutaneous changes visible in photos | Indirect — tracks what correlates with visceral, not visceral itself | Low — subscription |
| Belly texture test | Qualitative hard vs soft signal | Low-moderate — directional only | Free |
What Progress Photos Can and Cannot Show
Progress photos are the most common way people track body composition changes — and they are genuinely useful, with one important limitation: they show subcutaneous fat, not visceral fat.
The fat that shows up in a photo — the belly that protrudes, the love handles, the definition of muscle underneath — is all subcutaneous. It sits between skin and muscle, and light and shadow interact with it directly. That's why progress photos work for tracking whether you're gaining or losing subcutaneous fat over time.
Visceral fat sits behind the abdominal wall. Changes to visceral fat do not directly change what a photo captures. However, there are indirect signals:
- Belly protrusion decreasing while subcutaneous fat appears similar can indicate visceral reduction. The belly gets flatter without the visible layer thinning much yet.
- Upper abdominal area flattening before lower belly changes is a pattern consistent with visceral-first reduction.
- Clothes fitting differently before photos look meaningfully different is the most common early marker that visceral fat is responding to the deficit.
This is the honest framing for anyone frustrated that their photos don't show what they feel is real progress: the visceral layer often moves first, and photos won't show that. The waist measurement will.
Tracking Body Fat % Trend as a Visceral Fat Proxy
Overall body fat percentage and visceral fat accumulation move together — when you reduce total body fat percentage, visceral fat typically drops. Research consistently shows visceral fat is more metabolically responsive than subcutaneous fat, meaning it tends to reduce faster per unit of caloric deficit.
Tracking your body fat percentage trend over months gives you the closest thing to a visceral fat progress signal available without lab equipment. A consistently declining BF% trend, even if slow, means visceral fat is going with it.
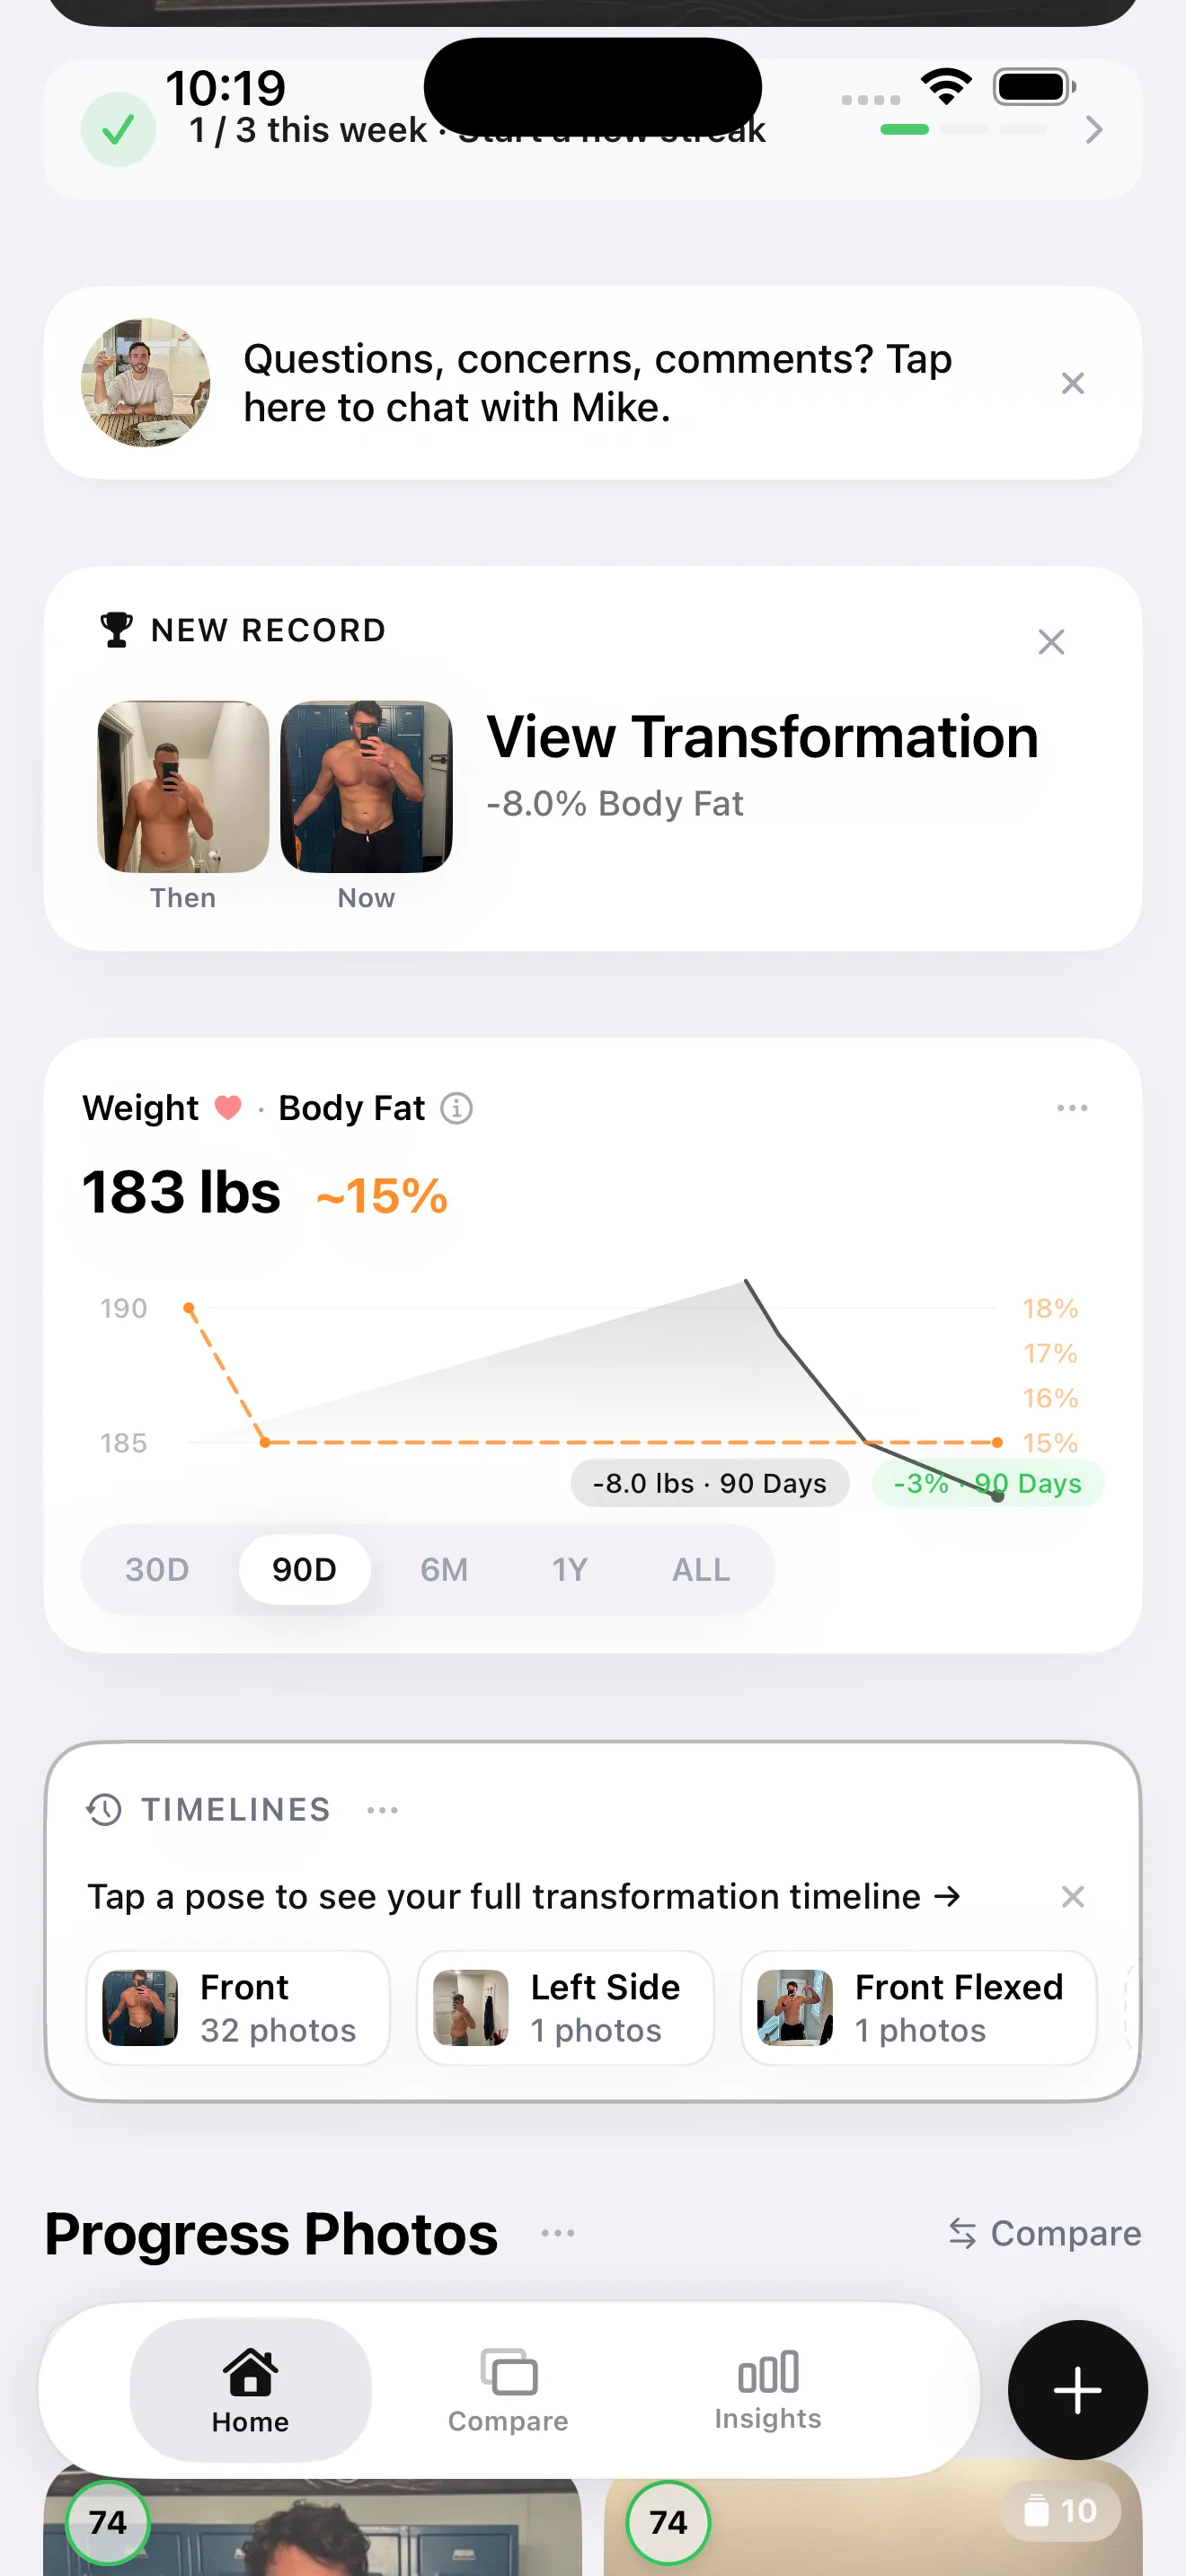
GainFrame uses AI analysis of your progress photos to estimate body fat percentage from the visual changes visible in each check-in. Over months of check-ins, you build a trend line that reflects whether your overall composition is improving — which is the most useful proxy for visceral fat change that a smartphone-based tool can give you.
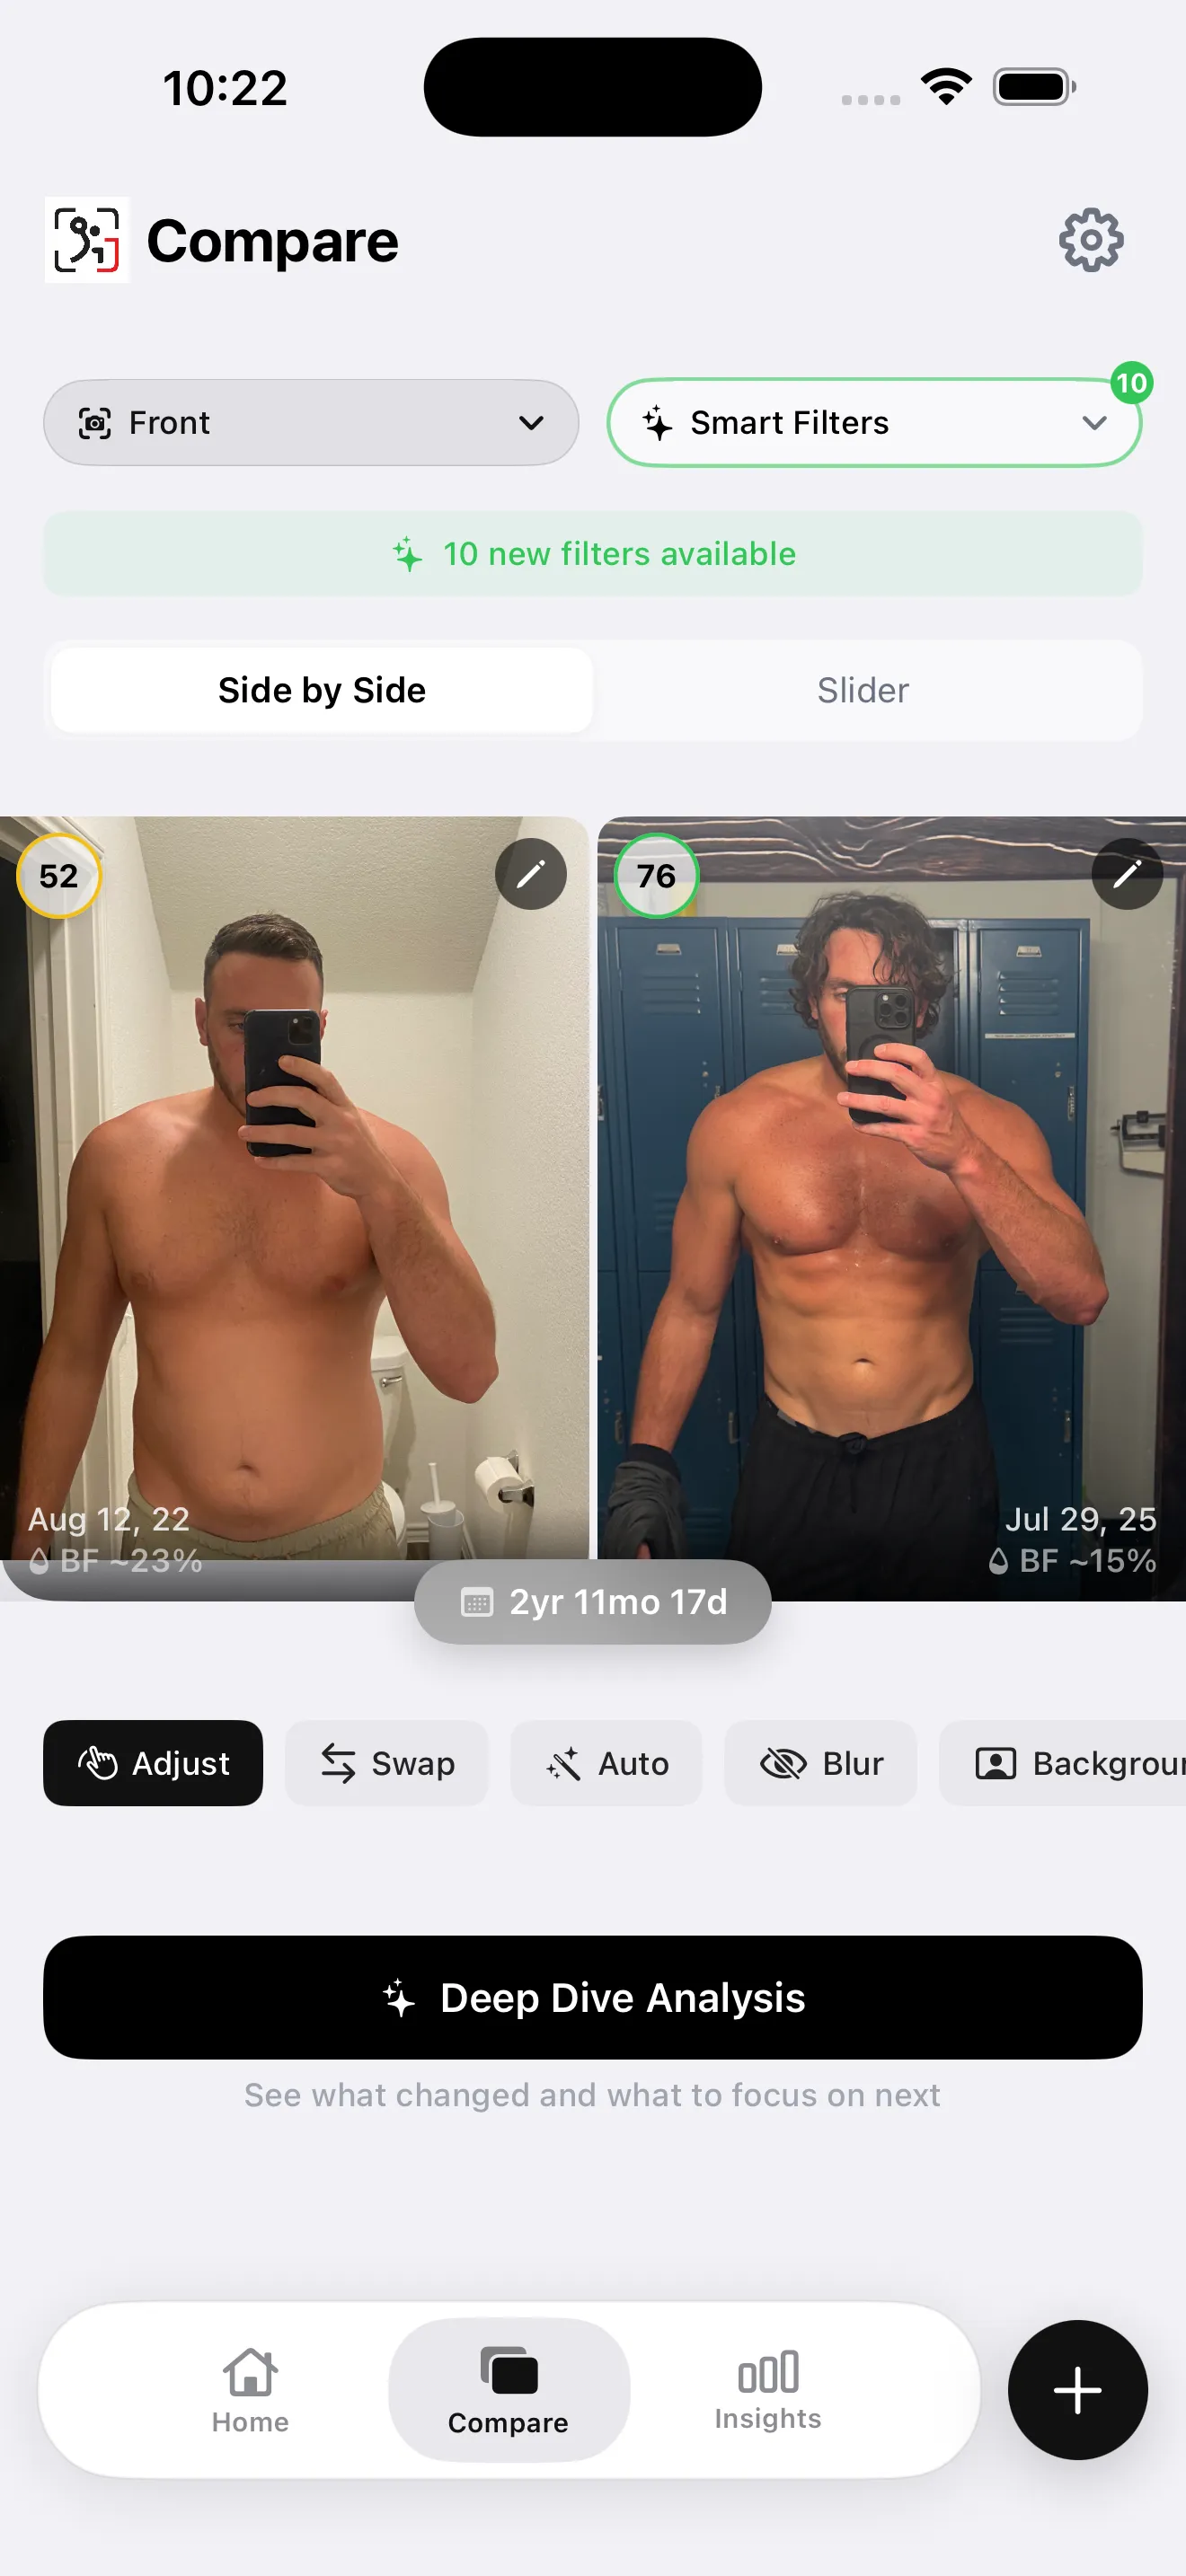
The comparison view shows the delta over any selected timeframe — useful for distinguishing real composition change (sustained BF% reduction over months) from noise (single readings that move up or down day to day). Visceral fat does not respond to a single week of dieting; it responds to sustained caloric deficit and improved metabolic health over time.
A Practical Protocol for Monitoring Visceral Fat
Same time of day, same point above the navel, same relaxed (not sucked in) posture. Log the number. Trend matters; single readings do not. A waist decreasing by 0.5–1 inch per month over 3–6 months is meaningful visceral reduction.
Consistent lighting, posture, and angle (GainFrame prompts you for these). The trend line across 6–12 months of check-ins is far more informative than any individual reading.
If you want the closest non-CT approximation of visceral fat, DEXA's android fat mass measurement is the answer. One scan per year gives you a clinical anchor point for the trend data you're collecting between scans.