A 5'10" competitive powerlifter weighing 220 lbs at 10% body fat has a BMI of 31.6. The clinical classification: obese. The reality: one of the leanest people in their gym. BMI doesn't know the difference. Body fat percentage does.
If you don't lift, BMI is a reasonable population-level screening tool. If you do lift — even casually — it starts lying to you the moment you build enough muscle to shift the scale. Here's what each metric is actually measuring, where each one holds up, and which one you should care about.
Body Fat % vs BMI: The Side-by-Side
| Property | BMI | Body Fat % |
|---|---|---|
| Formula | Weight (kg) ÷ Height² (m) | Fat mass ÷ Total body weight × 100 |
| What it accounts for | Weight and height only | Actual ratio of fat to lean tissue |
| Muscle awareness | None — muscle and fat weigh the same to BMI | Full — muscle adds to lean mass, not fat mass |
| Who it works for | Sedentary population screening; large epidemiological studies | Anyone tracking body composition, especially lifters |
| Who it misleads | Trained athletes, bodybuilders, anyone with above-average lean mass | Works for most people; estimation method matters more than the metric itself |
| How to measure it | Any scale + height measurement. No equipment needed. | DEXA, hydrostatic, BIA scale, calipers, or AI photo estimation |
| Tracks recomp progress? | No — scale weight stays the same during recomp | Yes — fat percentage falls as fat drops and lean mass holds |
| Tracks muscle gain? | No — muscle gain looks identical to fat gain in BMI | Yes — falling body fat % with stable weight signals muscle gain |
What BMI Actually Measures
BMI — Body Mass Index — was developed by Belgian mathematician Adolphe Quetelet in the 1830s as a tool to describe the average body proportions of a population. It divides weight by height squared, producing a single number. It was never designed to evaluate individual body composition, and Quetelet himself did not intend it as a clinical diagnostic tool.
It became one anyway. BMI is now the default screening metric in most healthcare systems because it requires no equipment, no testing, and takes five seconds to calculate. For large population studies — where you need a quick proxy for fatness across millions of people — it performs reasonably well. The problem is that "reasonably well" at the population level means roughly correct on average. Individual lifters are not the average.
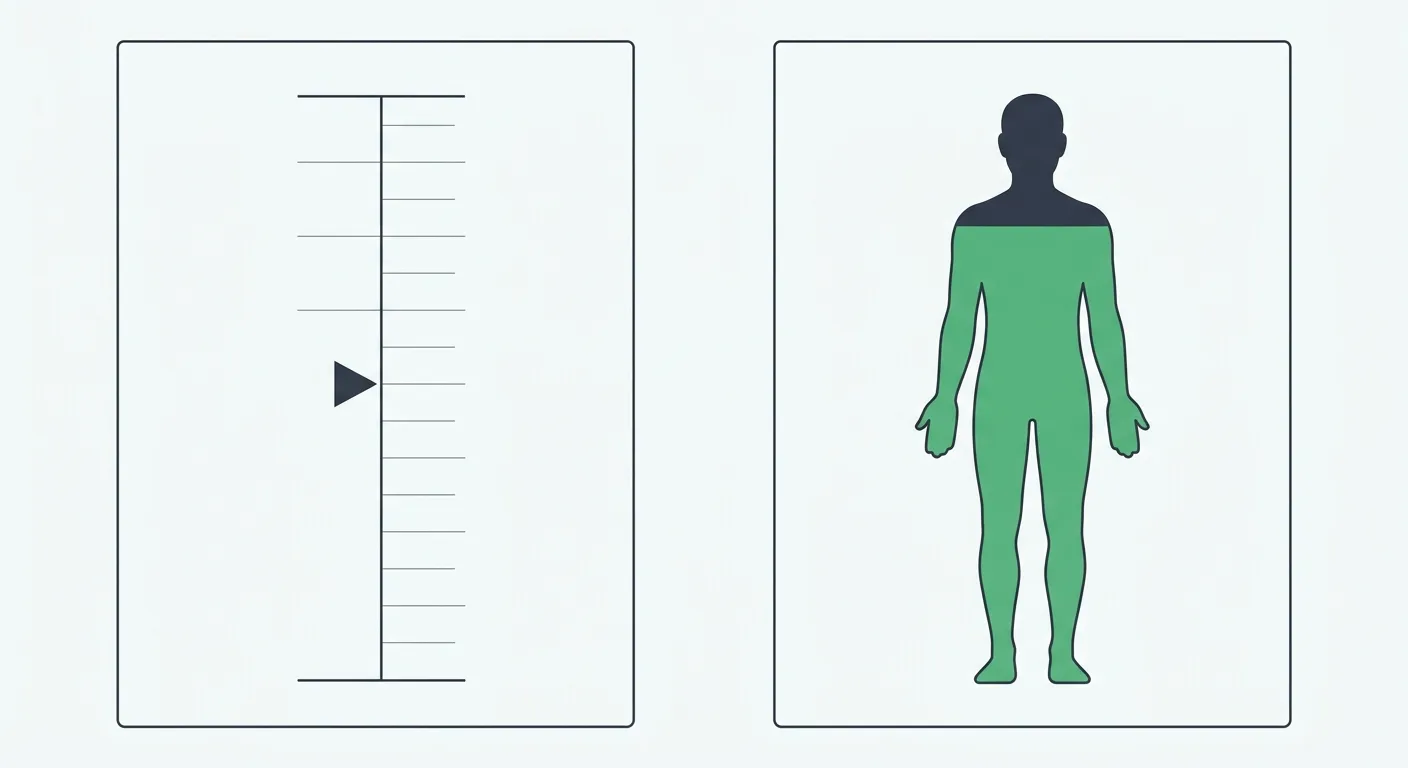
What Body Fat Percentage Actually Measures
Body fat percentage is exactly what it says: the fraction of your total body weight that consists of fat tissue. The other fraction — everything that isn't fat — is lean mass: muscle, bone, water, organs. Body fat percentage tells you how those two fractions relate to each other.
This is the number that matters for performance and aesthetics. You can't look lean at 30% body fat regardless of your BMI. You can look extremely lean at a BMI of 28 if that weight is mostly muscle. Body fat percentage cuts through the confusion that BMI creates and describes what's actually happening inside your body composition.
Where BMI Still Has a Use
It would be wrong to dismiss BMI entirely. For sedentary, untrained people — which is the majority of the adult population — BMI correlates reasonably with body fat percentage. Research suggests BMI is associated with health risks at the population level, and screening large groups of non-athletes for obesity-related health risk is faster and cheaper with BMI than with body fat measurements. It serves that purpose acceptably.
BMI also remains useful for anyone who doesn't have access to body fat measurement tools. If you've never lifted and you want a rough proxy for whether you're in a healthy weight range relative to your height, BMI will point you in the right direction. The metric breaks down specifically when trained muscle mass enters the equation.
The Muscle Penalty: Why BMI Lies to Lifters
Every pound of muscle you build increases your BMI. There is no adjustment, no exemption, no correction factor for training history. The formula treats a new pound of quadriceps the same way it treats a new pound of visceral fat. This creates systematic misclassification for anyone who trains seriously.
Consider the math on three different 5'10" men, all at 185 lbs — BMI 26.5, technically "overweight":
| Person | Weight | BMI | Body Fat % | BMI Category | Reality |
|---|---|---|---|---|---|
| Casual gym-goer, 3 yrs training | 185 lbs | 26.5 | 14% | Overweight | Lean, muscular |
| Sedentary office worker | 185 lbs | 26.5 | 28% | Overweight | Clinically overweight |
| Competitive powerlifter | 185 lbs | 26.5 | 9% | Overweight | Competition-lean |
Same BMI. Radically different body compositions. The metric cannot distinguish between them. Once you've been training seriously for 2+ years, BMI has essentially no useful information content for you as an individual.
Body Fat % Reference Ranges
Body fat percentage ranges vary by sex. Women carry a higher baseline of essential fat for hormonal and reproductive function — a low body fat percentage that is healthy for a man is often clinically problematic for a woman. These ranges are based on published norms from sports medicine and exercise science research:
| Category | Men | Women |
|---|---|---|
| Essential fat (minimum viable) | 2–5% | 10–13% |
| Athletes (competitive) | 6–13% | 14–20% |
| Fitness (serious gym-goer) | 14–17% | 21–24% |
| Average (healthy non-athlete) | 18–24% | 25–31% |
| Above average fat mass | 25%+ | 32%+ |
These are population-level reference ranges, not personal targets. Individual context matters — age, training history, and goals all affect what body fat percentage is optimal for a specific person. A competitive bodybuilder pre-show operates at 4–6%, a level that is unsustainable and often unhealthy outside of brief peaking periods. Most serious lifters aim to live in the Fitness or lower-Average range year-round.
Tracking Body Fat % Over Time
The number you get from a single body fat measurement matters less than the trend across multiple measurements taken under consistent conditions. Body fat percentage fluctuates with hydration, glycogen storage, and hormonal cycles — particularly in women. A single data point answers "where am I today." A trend line across 8–12 weeks answers "is my training and nutrition working."
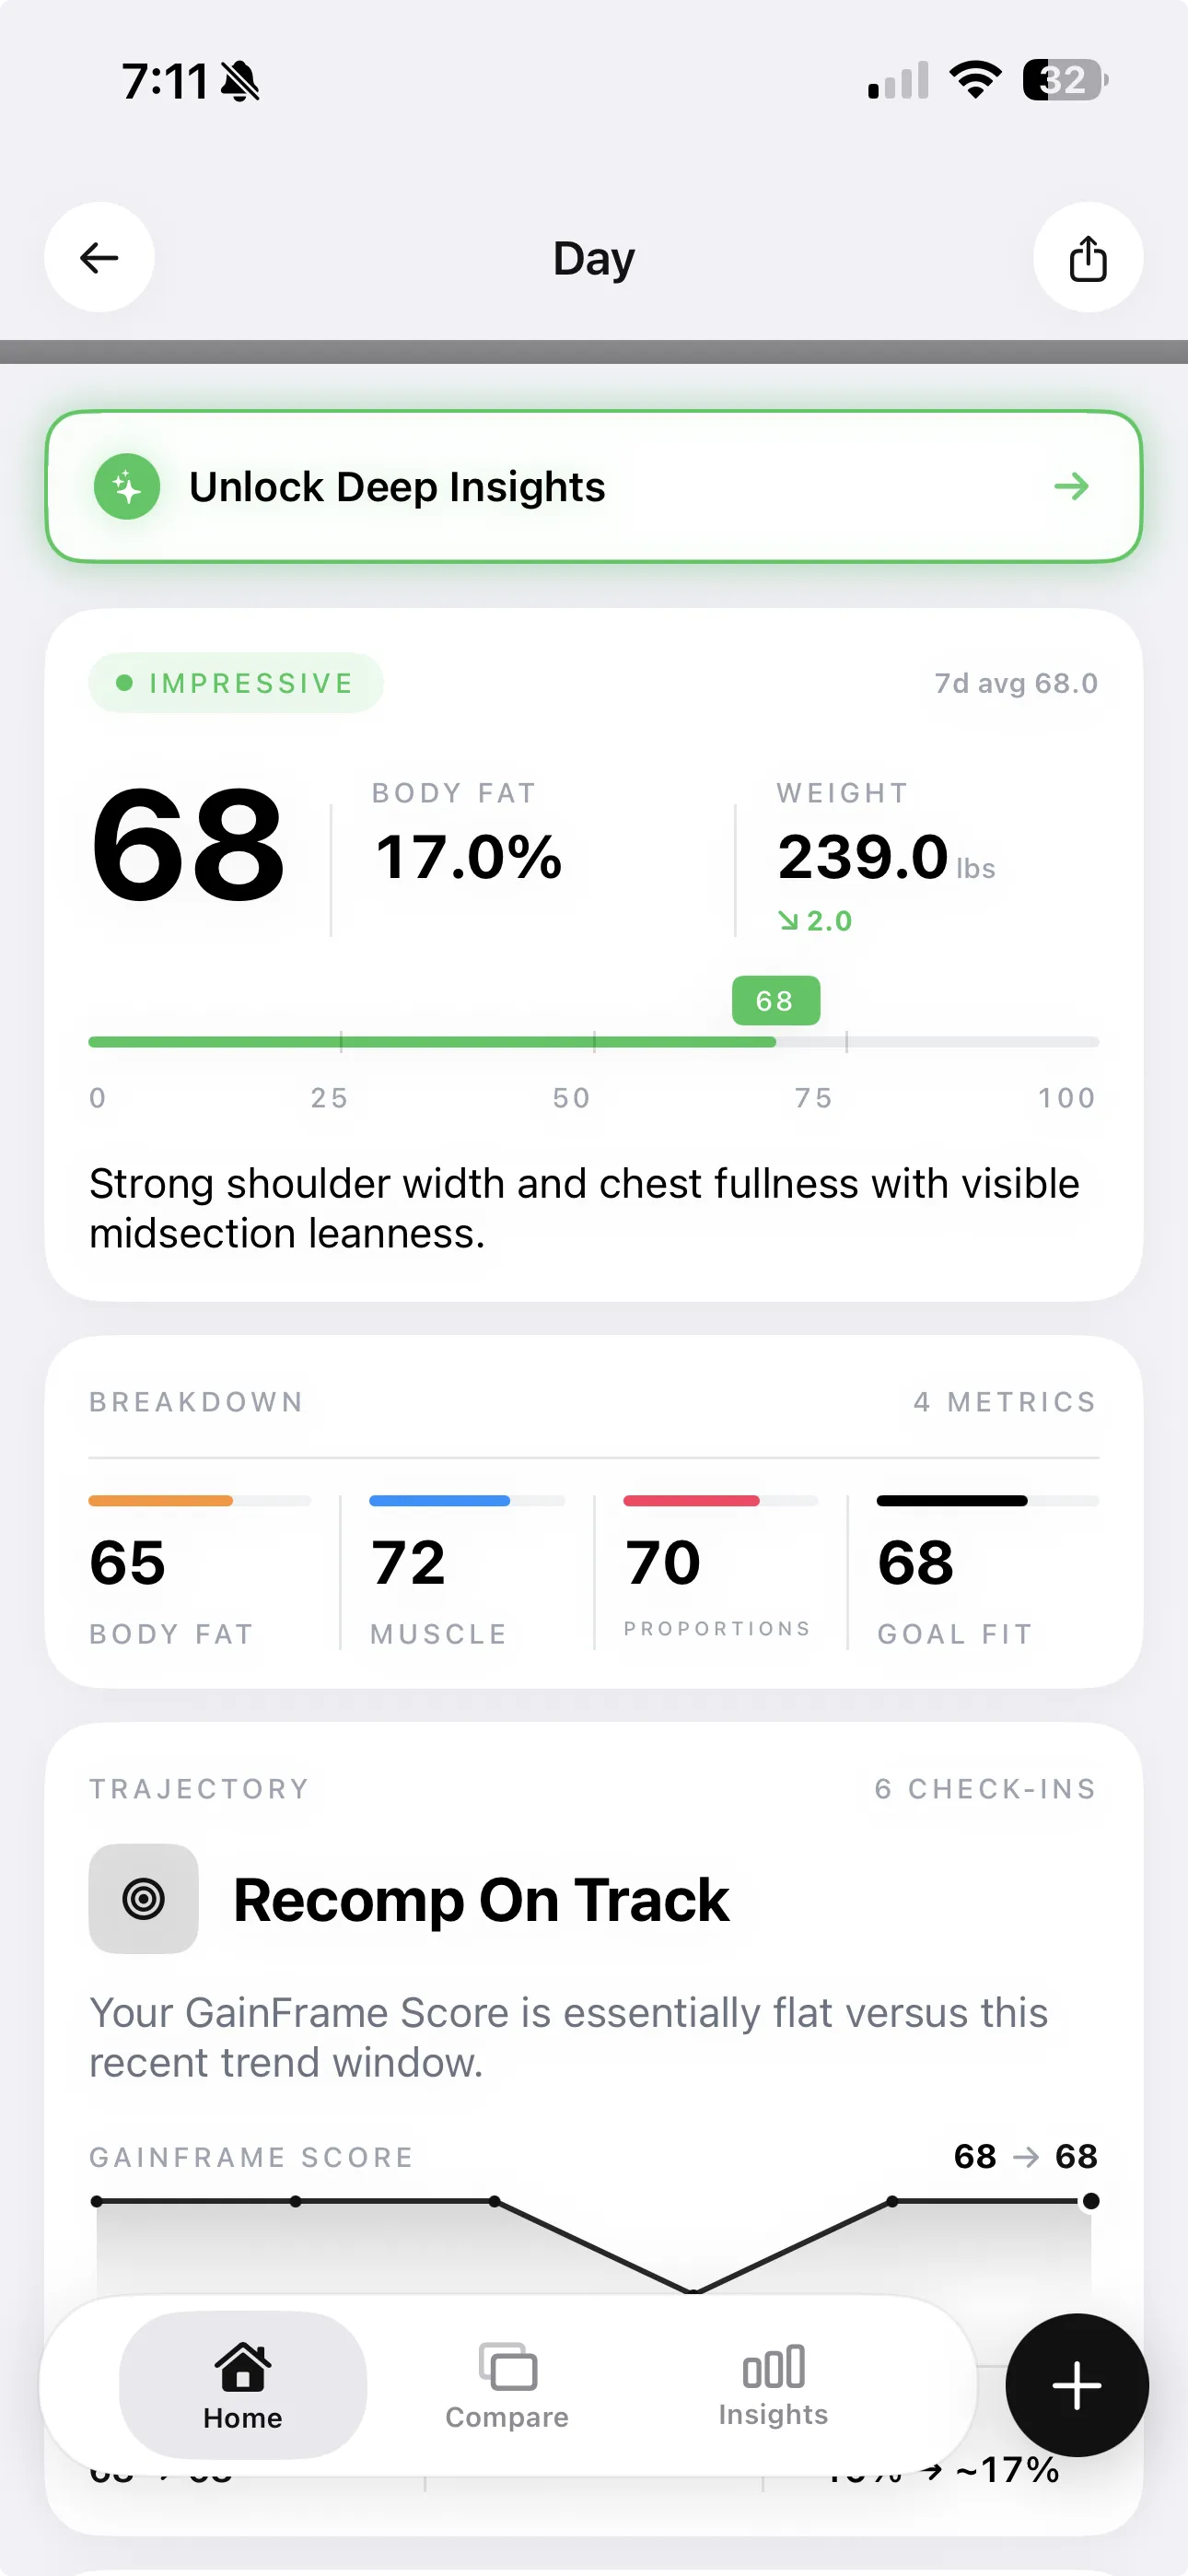
GainFrame's AI Deep Dive estimates body fat percentage from a photo, then tracks how that number changes check-in to check-in. Because the estimate is based on visual assessment rather than a conductivity reading, it's less sensitive to same-day hydration swings than a BIA scale. The trade-off: photo-based estimates carry more variance than DEXA on any single measurement, which makes the trend signal even more important than the absolute number.
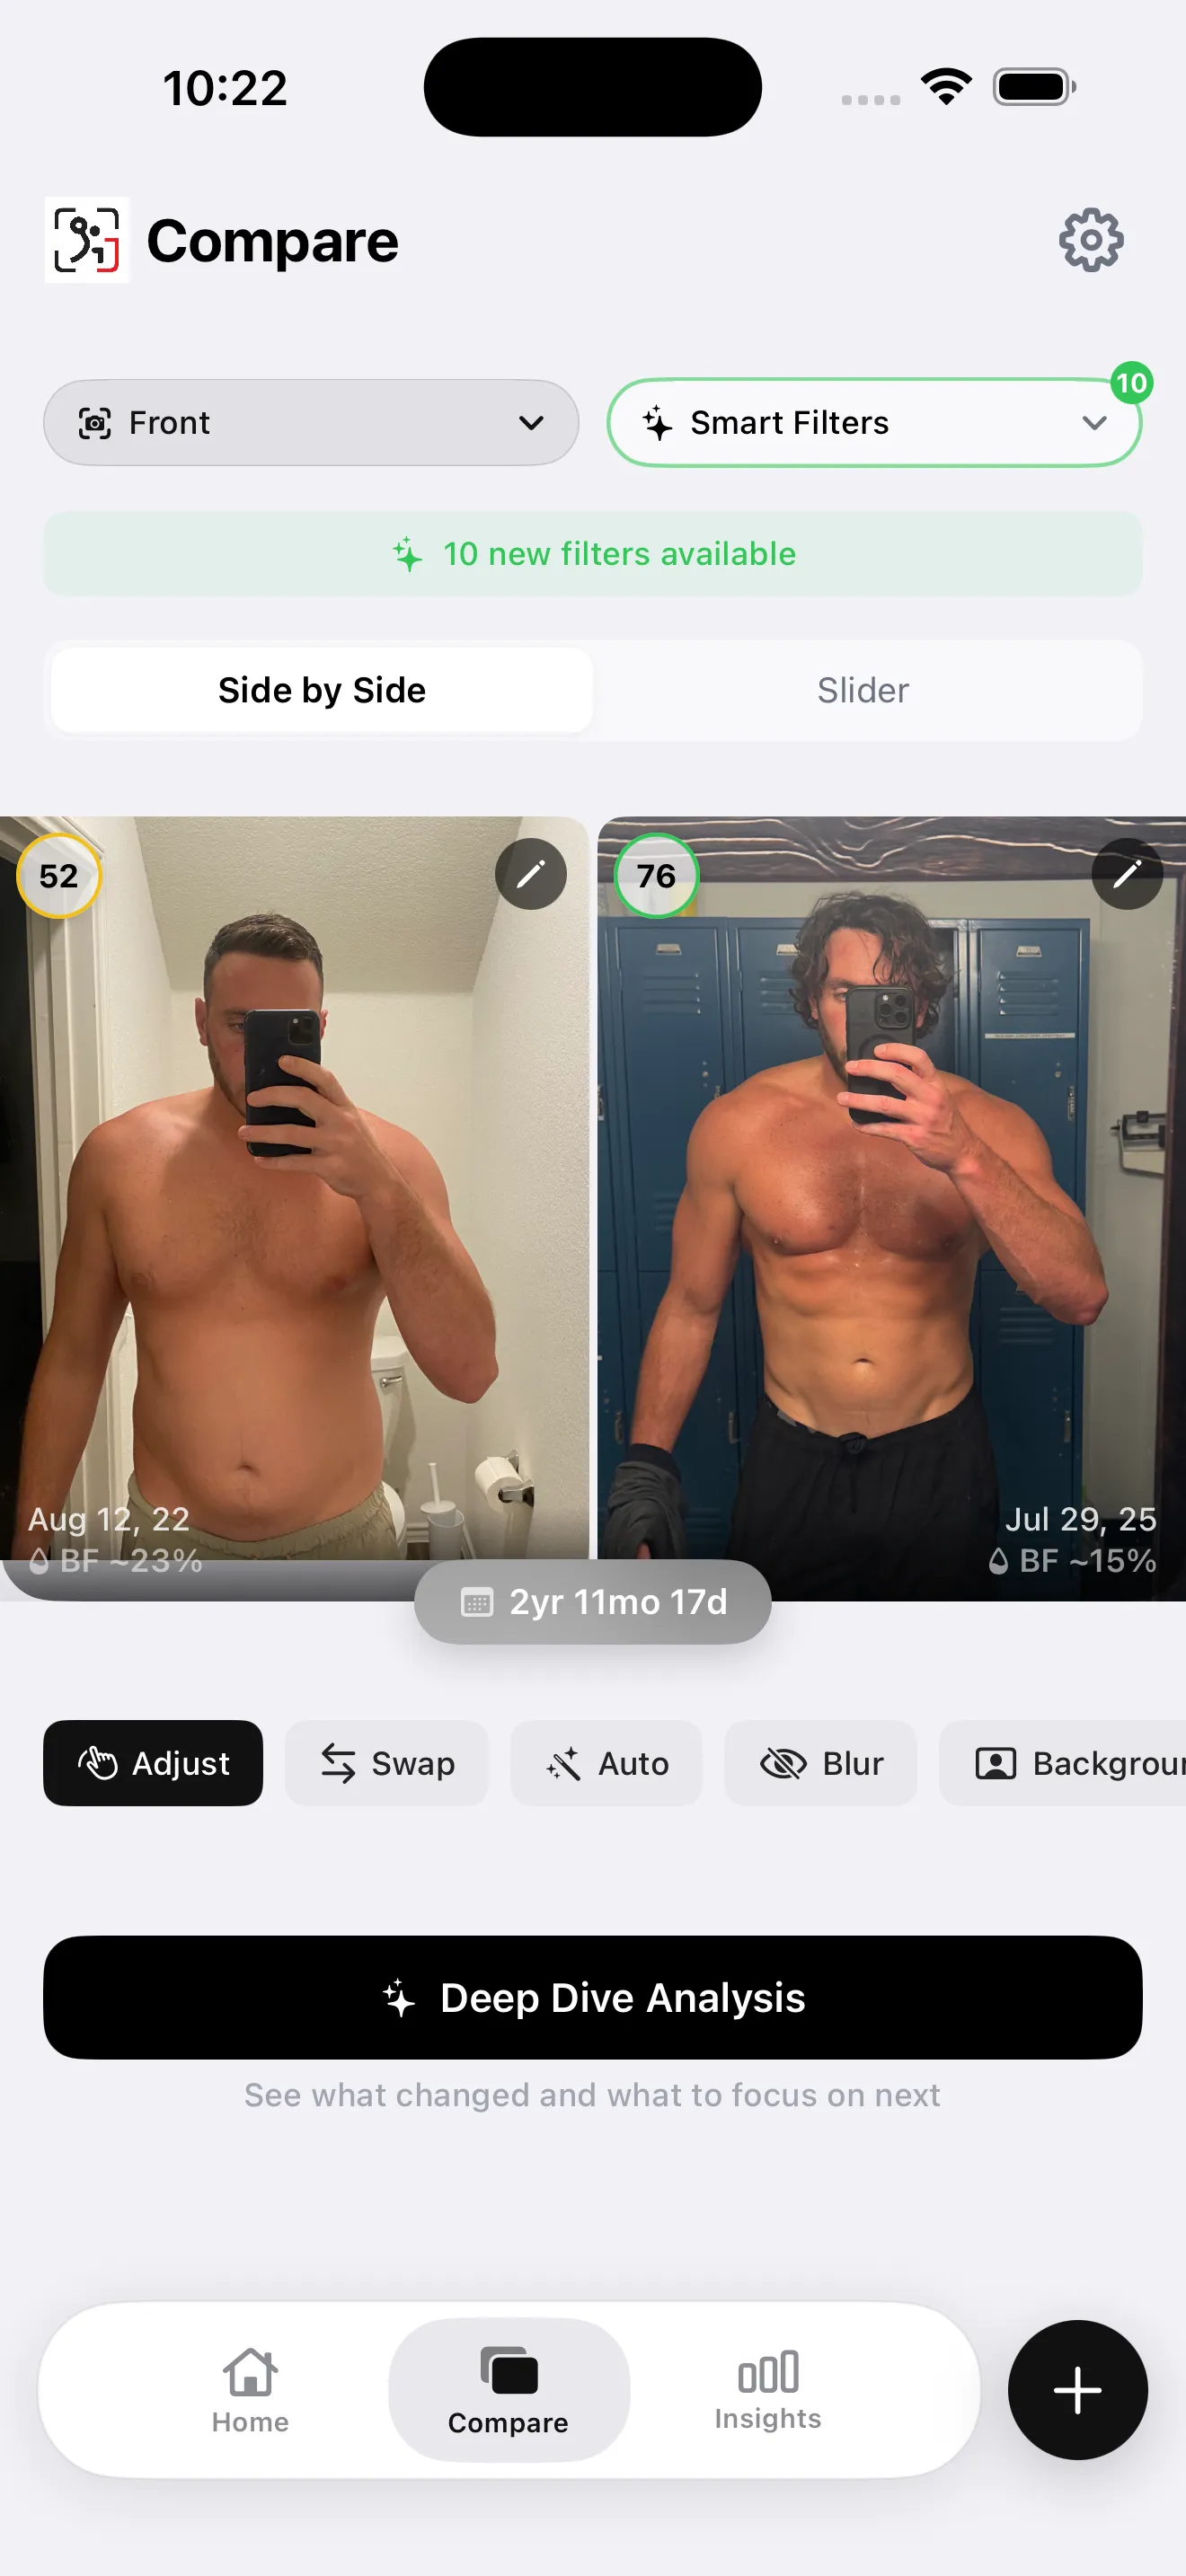
The Compare feature puts the trend in concrete visual terms: body fat delta between any two photos, time elapsed, and the side-by-side to confirm the number matches what you can see. A −5% body fat shift over 6 months is meaningful progress. The scale might have barely moved. BMI would be identical. Body fat percentage is the metric that captures it.
Which Metric to Use: A Decision Framework
- If you train at least 2–3 times per week: ignore BMI entirely. The muscle penalty makes it systematically inaccurate for you. The only reason to know your BMI is if a doctor asks for it as a screening number — even then, knowing your body fat percentage is more informative and you can offer it instead.
- Pick a body fat measurement method and stick to it. Consistency matters more than precision. Switching from BIA to DEXA to AI photo estimation mid-tracking introduces method variance that obscures your actual trend. Pick one, use it regularly, compare against itself over time.
- Pair body fat % with lean mass metrics. Body fat percentage falling is good. Body fat percentage falling while lean mass holds or rises is great — that's recomp confirmed. FFMI captures the lean mass side; body fat percentage captures the fat side. Together they give the complete picture.
- Reassess every 4–6 weeks, not weekly. Body fat percentage changes slowly enough that weekly measurements are mostly measuring noise. A 6-week interval gives the signal time to emerge above the variance of the estimation method.