Your doctor runs a BMI check. The number comes back at 27 — technically "overweight." You've been training four days a week for three years. You can see your abs. You're leaner than most people in your gym. The metric is broken, and you know it.
FFMI — the Fat-Free Mass Index — is the number serious lifters track instead. It accounts for the one thing BMI ignores: how much of your weight is muscle. A 200 lb powerlifter and a 200 lb sedentary person have the same BMI. They do not have the same FFMI. Not even close.
What Is FFMI?
FFMI stands for Fat-Free Mass Index. It measures how much lean (fat-free) mass you carry relative to your height — a direct proxy for muscularity that BMI completely misses. Think of it as BMI with the fat stripped out.
Developed in the 1990s as a way to objectively compare muscle development across athletes of different sizes, FFMI became the go-to tool for researchers studying the upper boundaries of natural muscular development. It has since become standard vocabulary in the serious lifting community, precisely because it solves the muscle-penalty problem that makes BMI useless for trained athletes.
How to Calculate Your FFMI
The formula has two steps. First, calculate your fat-free mass: multiply your bodyweight by (1 − body fat percentage as a decimal). Then divide that number by the square of your height in meters. As a formula:
Fat-Free Mass = Body Weight × (1 − Body Fat %)
A concrete example: you weigh 185 lbs (84 kg) at 15% body fat. Your fat-free mass is 84 × 0.85 = 71.4 kg. You're 5'11" (1.80 m). FFMI = 71.4 ÷ (1.80²) = 71.4 ÷ 3.24 = 22.0.
Some calculators apply a "normalized FFMI" correction that adjusts for height (taller athletes tend to score slightly lower). This matters mostly at the extremes. For tracking your own progress over time, the raw formula is sufficient — what matters is whether the number moves, and in which direction.
FFMI Chart: What the Ranges Mean
FFMI ranges differ by sex because average baseline lean mass differs significantly. A score that indicates above-average development for a woman looks different than the same score for a man. Here are the standard reference ranges:
| FFMI (Men) | Category | What It Looks Like |
|---|---|---|
| Under 18 | Below Average | Minimal muscle development; untrained or significantly deconditioned |
| 18–20 | Average | Typical untrained male; some recreational activity |
| 20–23 | Above Average | Regular gym-goer; 1–3 years of consistent training |
| 23–25 | Excellent | Serious lifter; multiple years of dedicated, progressive training |
| 25+ | Elite / Rare | Statistical ceiling for natural athletes; approaching this range requires exceptional genetics and years of optimized training |
| FFMI (Women) | Category | What It Looks Like |
|---|---|---|
| Under 15 | Below Average | Minimal muscle development |
| 15–17 | Average | Typical untrained female |
| 17–19 | Above Average | Regular gym-goer; consistent training history |
| 19–21 | Excellent | Serious female lifter; well-developed muscularity |
| 21+ | Elite / Rare | Upper boundary for natural female athletes |
These ranges are reference norms, not hard rules. Individual variation is real — bone density, limb proportions, and training history all influence where a given person lands relative to "average." Use them as a directional benchmark, not a verdict.
Why FFMI Catches What BMI Misses
BMI was designed as a population-level screening tool in the 19th century, long before lifting culture existed. It divides weight by height squared — and treats muscle and fat as equivalent mass. A 220 lb person at 10% body fat scores identically to a 220 lb person at 35% body fat. For anyone who trains, this makes BMI nearly useless as a personal health metric.
FFMI solves this by working from fat-free mass rather than total weight. Muscle is dense; fat is not. Two people with the same height and lean mass will have the same FFMI regardless of how much fat they carry. You can lose fat, gain fat, or hold steady — FFMI tracks only the muscle side of the equation. That's exactly what a lifter needs to know.
Why FFMI Matters During Body Recomposition
Recomposition — simultaneously building muscle while losing fat — is one of the hardest things to verify on the scale. If you gain 2 lbs of muscle and lose 2 lbs of fat in a month, the scale reads exactly the same number it did 30 days ago. You might think you stalled. You didn't.
FFMI separates the signal from the noise. As your fat-free mass increases, your FFMI rises — even when your total weight doesn't budge. This is the specific situation where FFMI becomes irreplaceable: a rising FFMI alongside a stable scale is the clearest evidence that recomp is working. Tracking total weight during a recomp is like tracking the sum of two bank accounts while money shifts between them.
The Natural Limit: Where Does 25 Come From?
The upper boundary of around 25 FFMI for men became widely cited after a 1995 study by Kouri et al. that compared the lean mass distributions of steroid users versus non-users in competitive bodybuilders. The researchers found that no drug-free athlete in their dataset exceeded an FFMI of approximately 25, while many steroid users clustered above it. The number has since been replicated across several populations and is now used as a rough heuristic in natural bodybuilding.
It is important to be precise about what "25 as a natural ceiling" actually means. It means approaching 25 is uncommon, not impossible — exceptional genetics produce outliers. The app's disclaimer puts it correctly: values above 25 are extremely rare naturally. Not zero. Rare. And the ceiling for women is typically around 21, not 25.
How GainFrame Shows Your FFMI
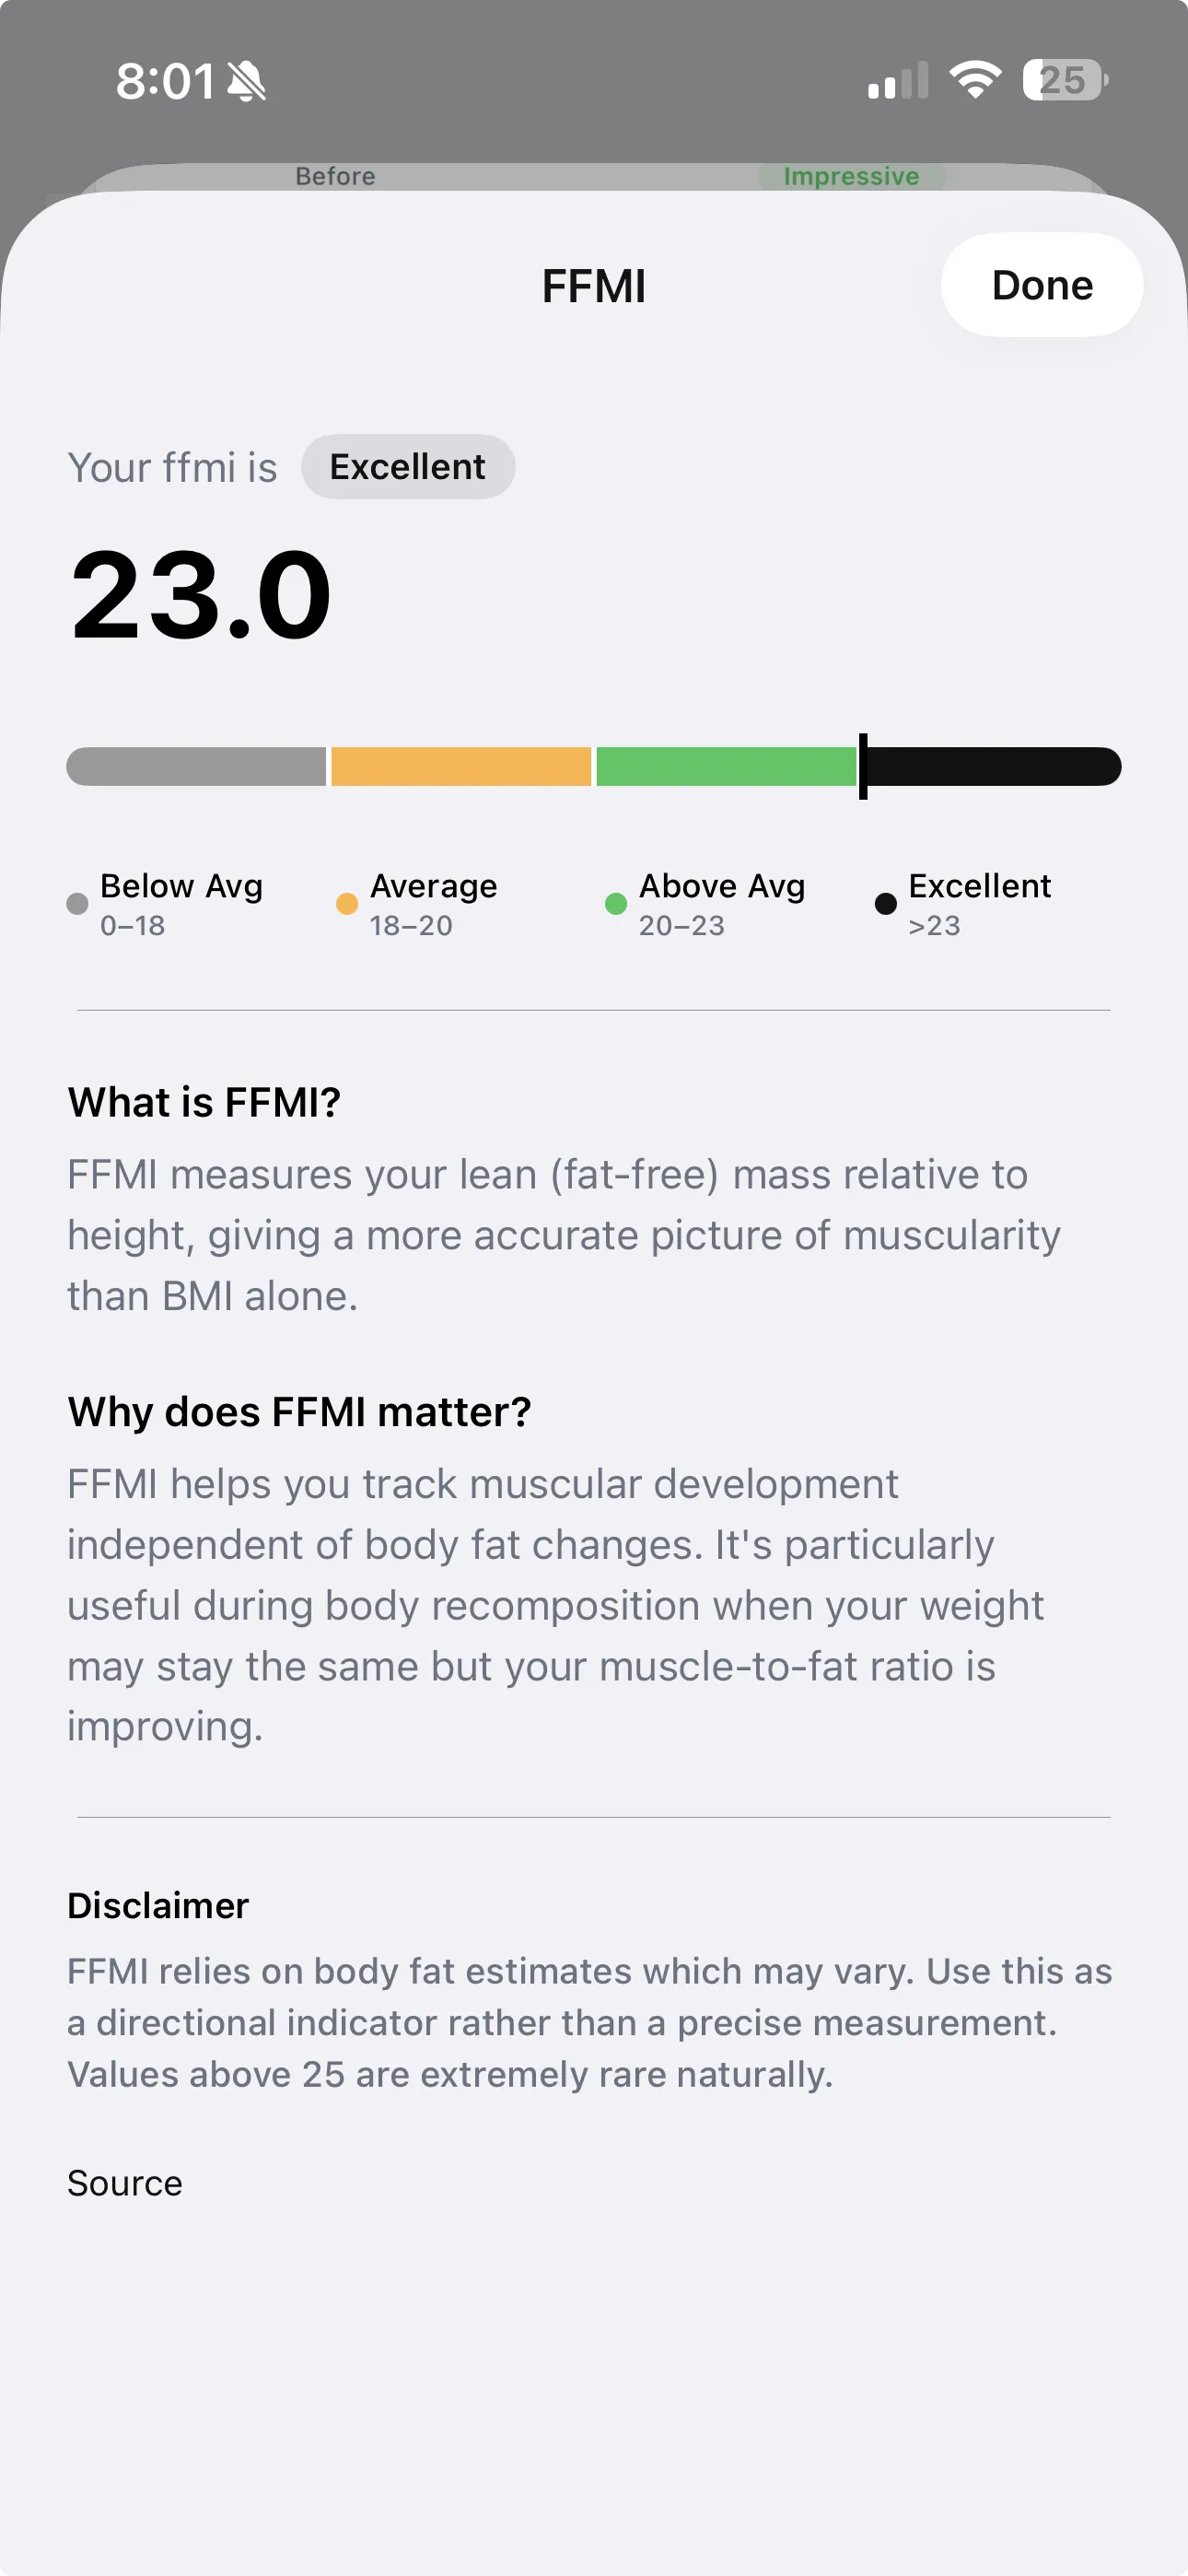
GainFrame's AI Deep Dive calculates your FFMI from a single photo — no DEXA scan, no calipers, no body fat scale. The app's vision model estimates your body fat percentage from the photo, applies that to your logged weight and height, and returns your FFMI alongside the range context. You can see at a glance whether you're Below Average, Average, Above Average, or Excellent, and the in-app explanation tells you exactly what the metric is tracking and why it matters during recomp.
The calculation updates every time you run a Deep Dive — so as your physique changes, your FFMI does too. Because the AI estimate carries some variance (lighting, pose, and body type all affect the read), the most useful data point isn't any single session's FFMI number. It's the trend line across multiple check-ins. A rising FFMI over 8–12 weeks is a meaningful signal. A single snapshot is a starting point.
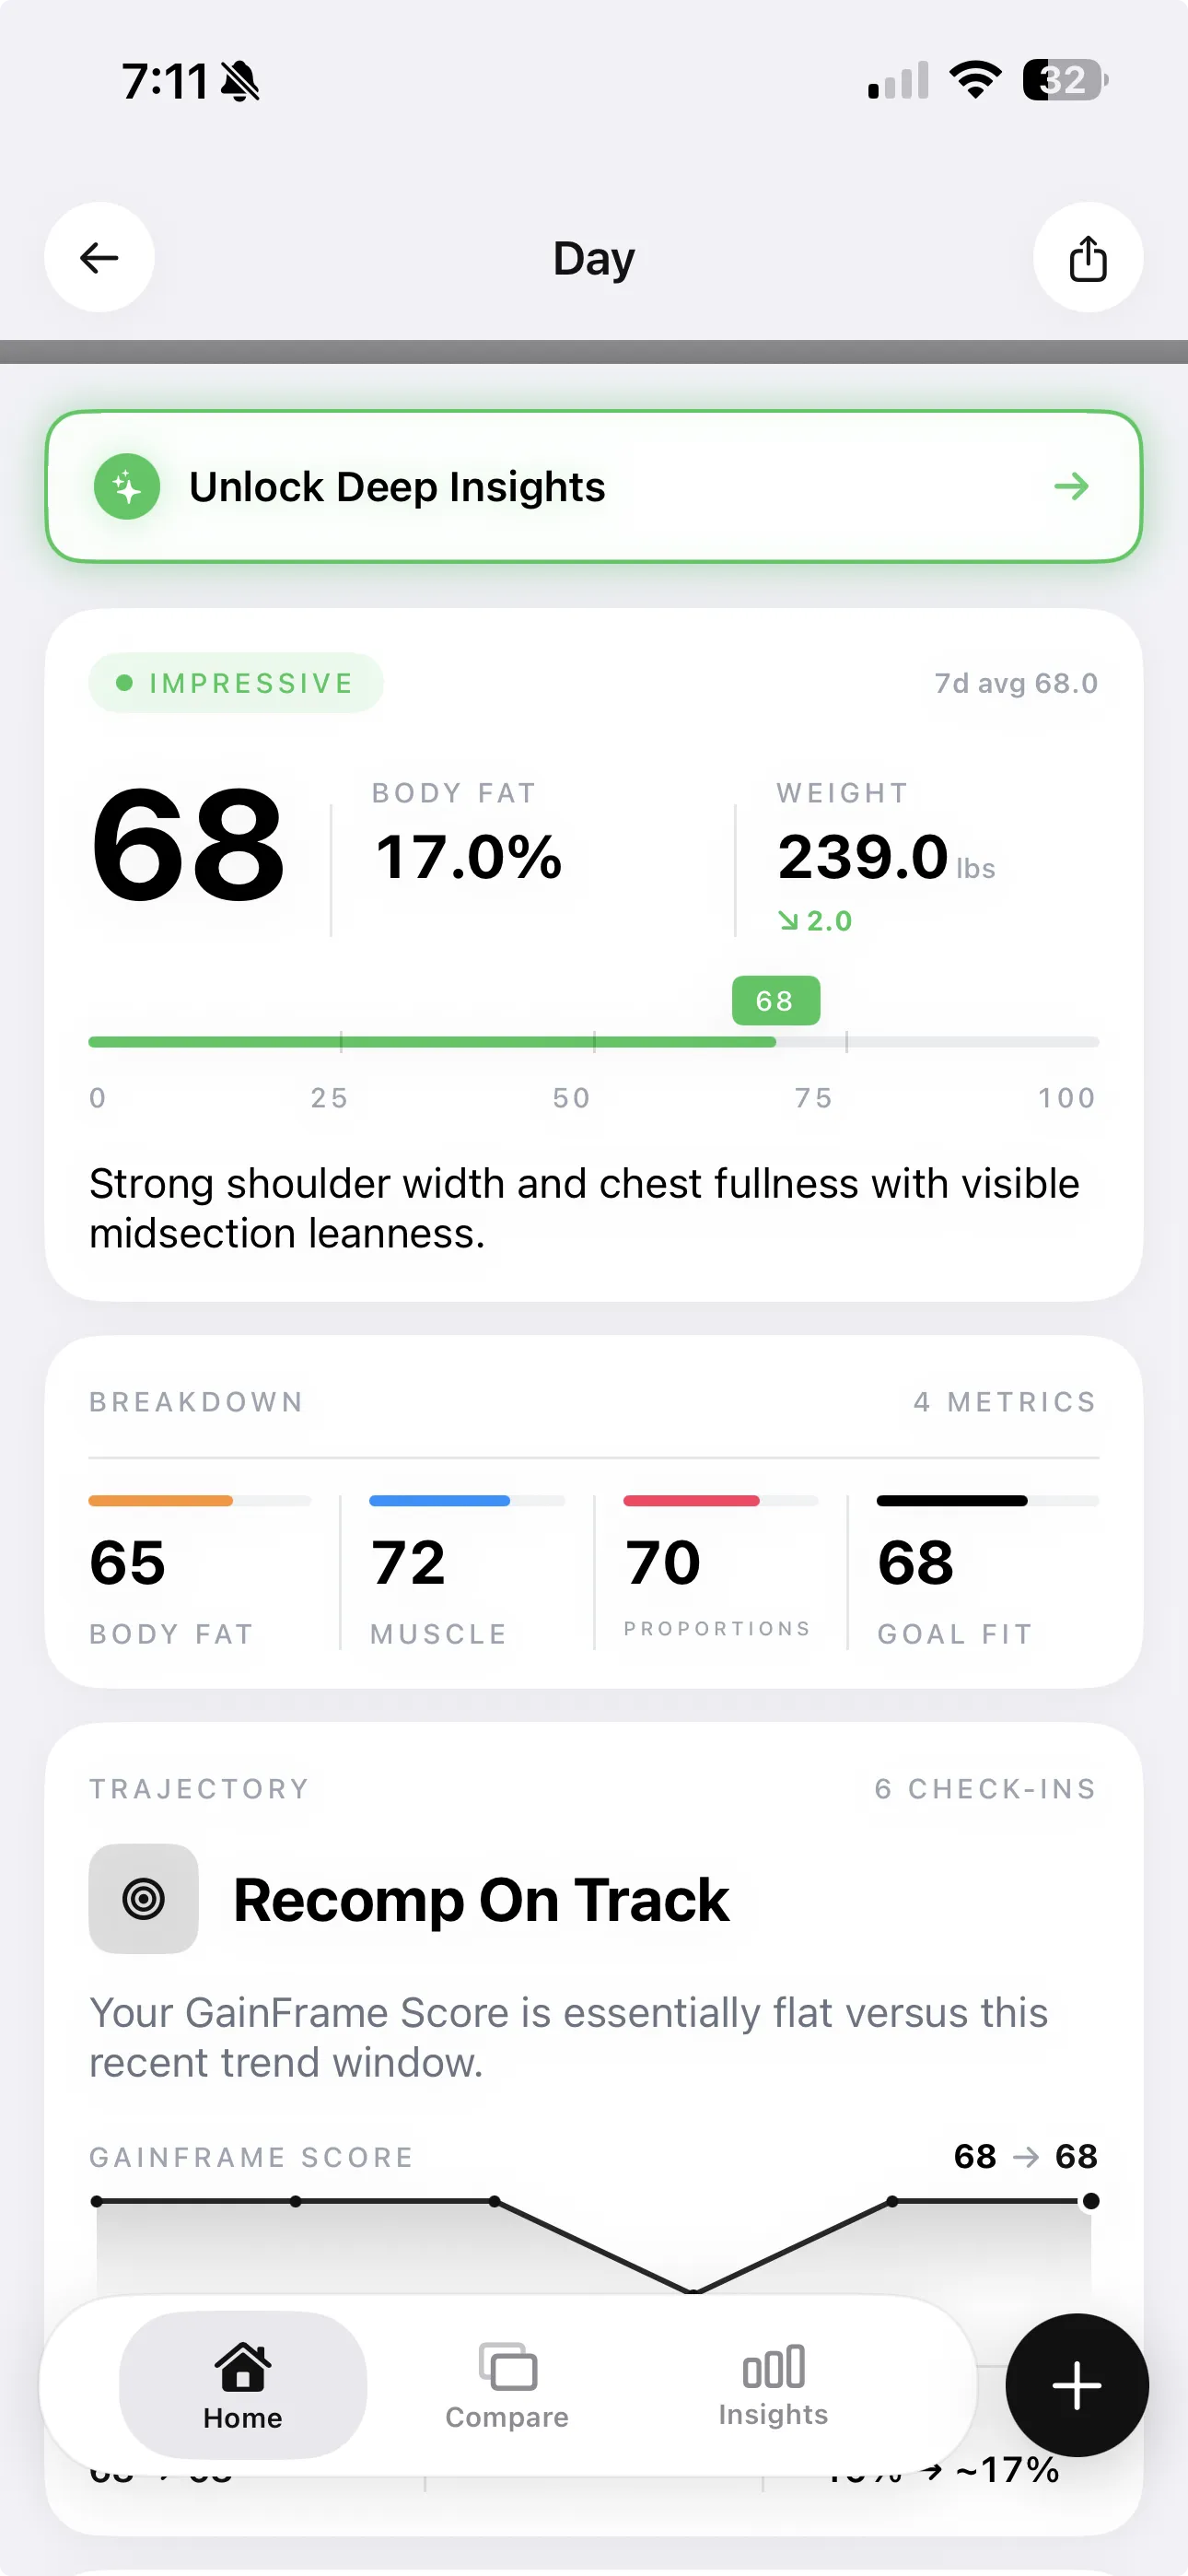
The Deep Dive Report surfaces FFMI as part of a complete picture: body fat percentage, lean mass, a GainFrame Score, 12 individual muscle group ratings, and a recomp trajectory. FFMI is one input to the broader analysis, not the only number worth tracking.
How to Use FFMI in Practice: A Three-Step Approach
- Establish your baseline. Calculate your current FFMI (or let an app do it). Don't interpret a single number as good or bad — you need a reference point before you can track direction. Write it down with today's date.
- Set your tracking cadence. Reassess every 4–6 weeks. FFMI shifts slowly — weekly check-ins will just show noise from body fat estimate variance. Monthly or bi-monthly intervals give the signal time to separate from the noise.
- Track the trend, not the absolute number. An FFMI rising from 20.1 to 21.4 over a 12-week bulk is a meaningful gain. An FFMI sitting at 20.1 across 16 weeks while you're in a caloric surplus signals that something in your training or nutrition needs adjustment. The comparison is always against your own history, not against a reference chart.