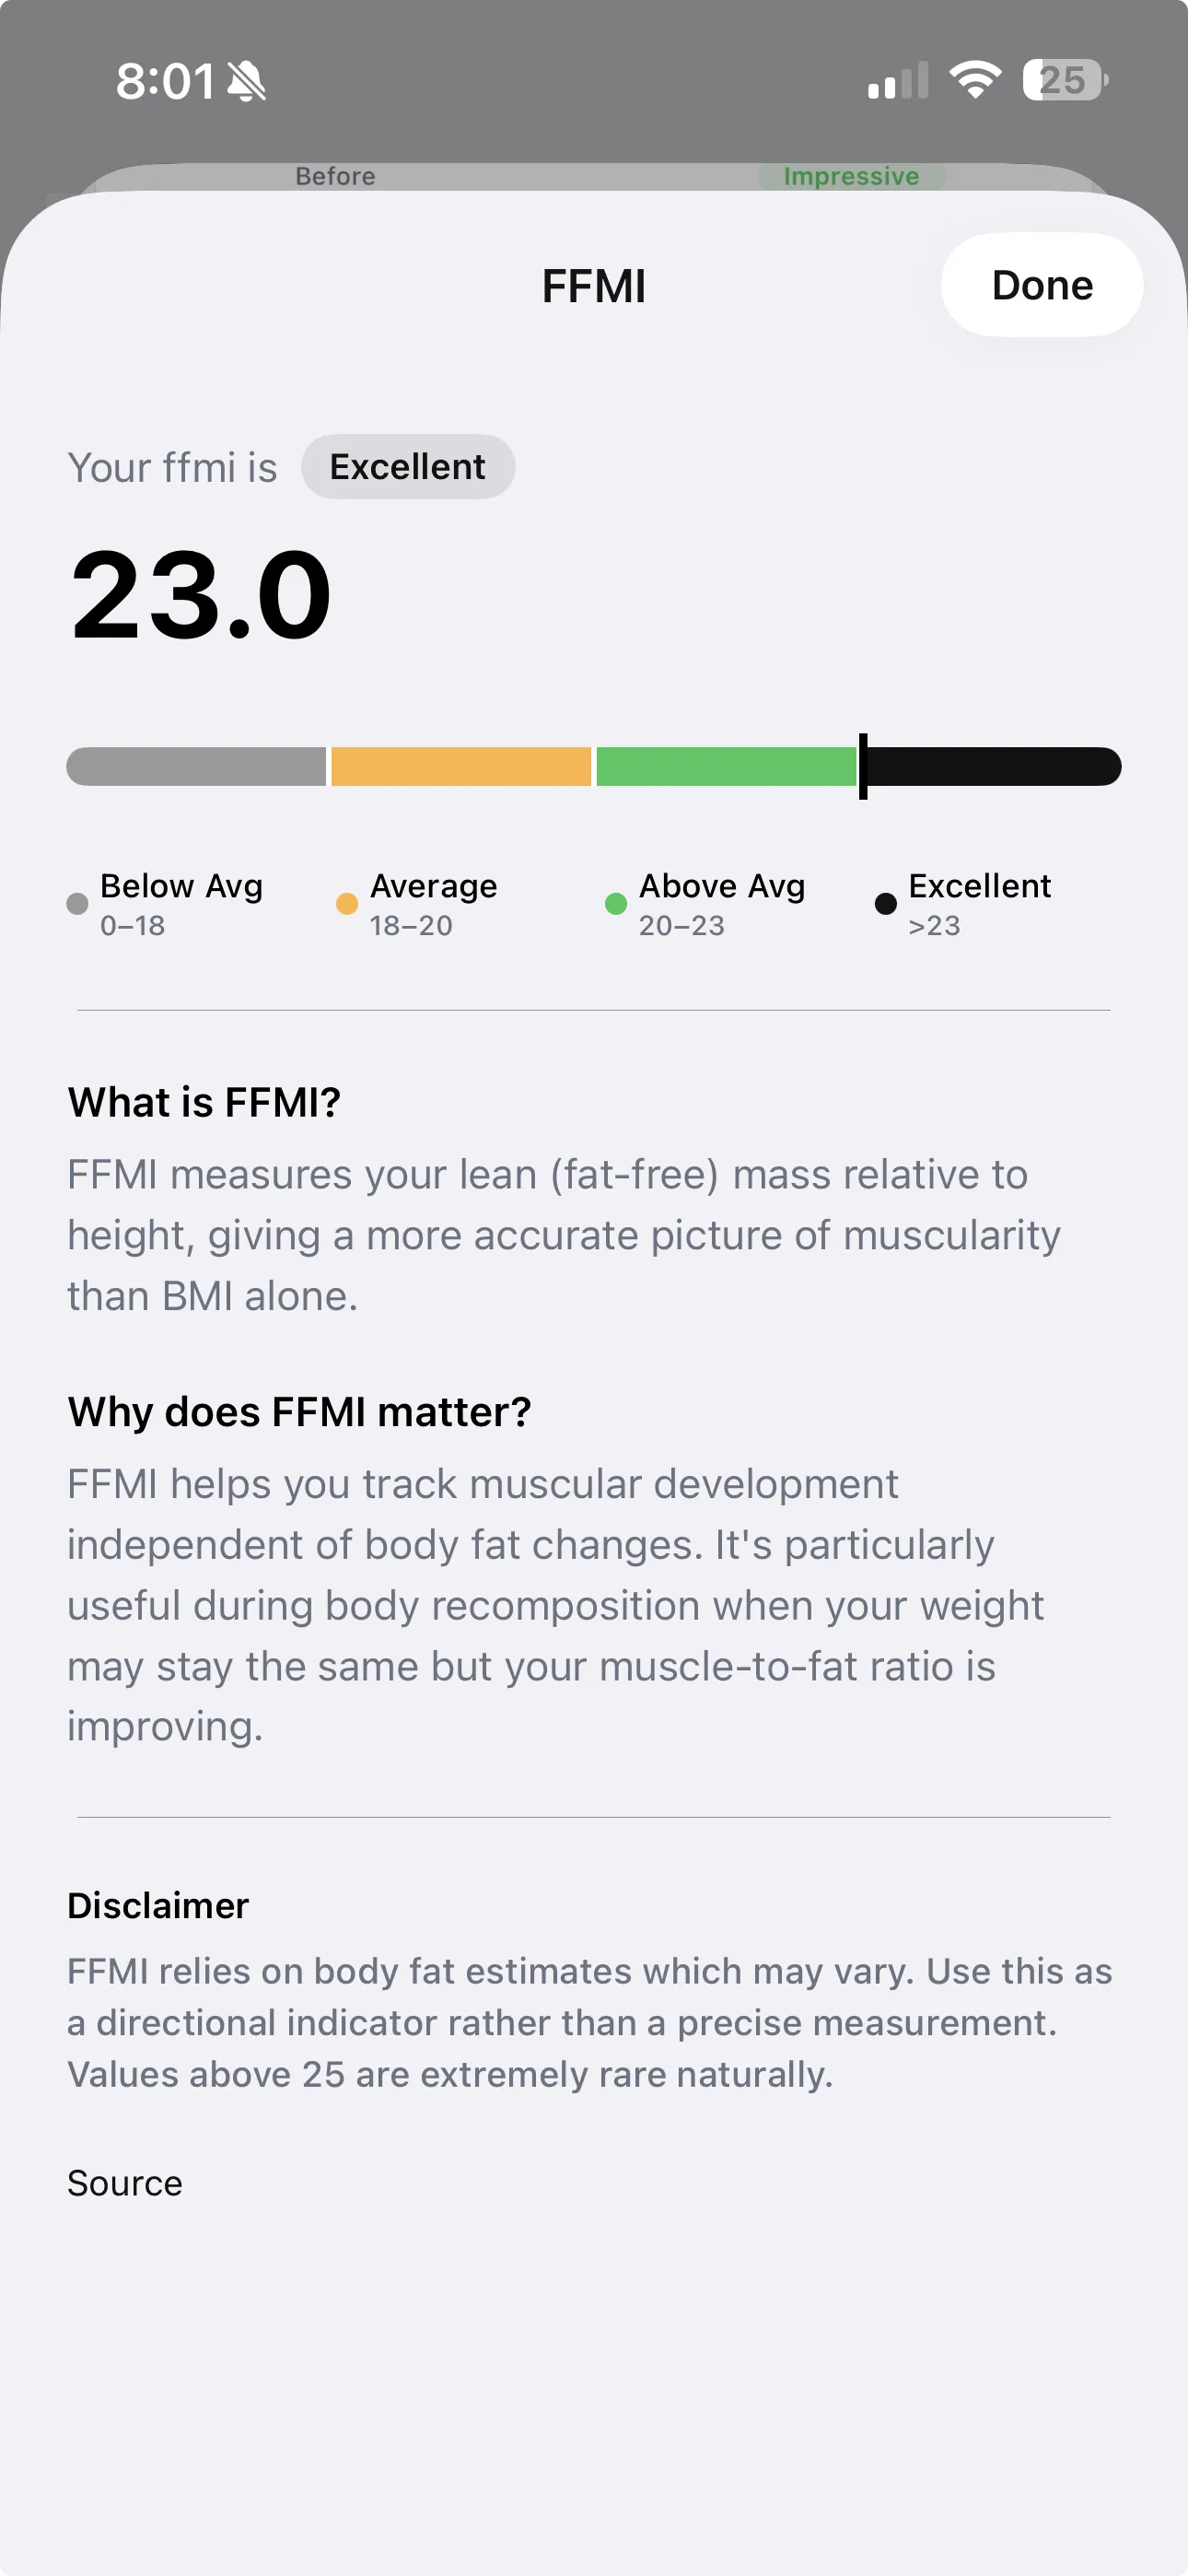
You ran the numbers. Your FFMI came out at 21.8. Now what? A number without context is just a number. The chart below maps every FFMI tier — for men and women — to what it actually represents in terms of training history, physique development, and proximity to the natural ceiling.
If you're not sure how FFMI is calculated, read What Is FFMI? first — this article is the companion reference. If you already know the formula, jump straight to the charts below.
FFMI Chart for Men
Men generally carry more lean mass than women as a baseline, so the reference ranges are higher. These tiers reflect what training history and genetic potential typically look like at each point on the scale.
| FFMI | Tier | What It Typically Looks Like |
|---|---|---|
| Under 16 | Far Below Average | Sedentary, possibly underweight or recovering from illness. Very low muscle mass relative to height. |
| 16–18 | Below Average | Typical untrained male with little gym history. No visible muscle development. Skinny or skinny-fat profile. |
| 18–19 | Beginner | Early training stage (under 6 months). Some definition emerging but limited overall mass. "Just started lifting" physique. |
| 19–20 | Intermediate | 1–2 years of consistent training. Visible muscle in trained areas, some definition. Noticeable difference from untrained peers. |
| 20–22 | Above Average | 2–4 years of progressive training with decent nutrition. Clear shoulder width, chest development, and leg mass. Looks like someone who lifts. |
| 22–24 | Excellent | Serious lifter with 4+ years of dedicated programming. Full muscle development across major groups. Lean mass that's immediately visible at any body fat level. |
| 24–25 | Elite / Near Natural Ceiling | Top-tier natural athletes. Exceptional genetic response to training required. Competitive-level development. Sustaining this range long-term is uncommon even among serious lifters. |
| 25+ | Statistically Rare Naturally | Documented in very few natural athletes. Historically associated with performance-enhancing drug use in research populations. Does not mean impossible — means unusual enough to warrant scrutiny. |
FFMI Chart for Women
Women's FFMI ranges run approximately 3–4 points lower than men's across equivalent tiers. This reflects baseline hormonal differences in muscle-building capacity — not a lesser achievement. A woman at FFMI 20 has accomplished roughly the same relative development as a man at FFMI 23–24.
| FFMI | Tier | What It Typically Looks Like |
|---|---|---|
| Under 14 | Far Below Average | Very low lean mass. Sedentary or underweight profile. |
| 14–15 | Below Average | Typical untrained female. Minimal muscle development relative to height. |
| 15–16 | Beginner | Early training history. Some tone emerging in trained areas. First year of consistent gym attendance. |
| 16–17 | Intermediate | 1–2 years of progressive training. Visible muscle definition in shoulders, arms, and legs. Noticeably developed physique. |
| 17–19 | Above Average | 3–5 years of dedicated lifting and nutrition. Full shoulder development, visible leg mass, athletic build. |
| 19–21 | Excellent | Serious female lifter with years of optimized programming. Competitive physique territory. Lean mass clearly visible even at moderate body fat levels. |
| 21+ | Elite / Near Natural Ceiling | Rare in natural female athletes. Exceptional genetics and training history required. Equivalent achievement to men above 24. |
The 25 Ceiling: What It Actually Means
The frequently cited "natural limit of 25" for men originated in a 1995 study by Kouri et al. that compared competitive bodybuilders who used anabolic steroids against those who did not. The researchers found that no confirmed drug-free athlete in their dataset exceeded an FFMI of approximately 25, while enhanced athletes consistently clustered above it.
This does not mean everyone at FFMI 25 is using drugs, or that 25 is a hard cap. It means the statistical overlap between natural and enhanced populations starts to narrow significantly above that point. At FFMI 24, you're almost certainly natural. At FFMI 26, the odds shift. It's a probabilistic range, not a binary line.
A few important caveats: the Kouri study used controlled body fat measurements (hydrostatic weighing), not the photo-based or bioimpedance estimates most people use. AI and BIA estimates carry ±2–4% body fat variance, which translates to real variation in your calculated FFMI. If your estimated FFMI comes out at 25.2, your actual FFMI could be anywhere from 23.5 to 27 depending on the accuracy of the body fat estimate underneath it.
How to Locate Yourself on the Chart
To find your position on the chart you need three inputs: body weight, body fat percentage, and height. The formula is straightforward — fat-free mass divided by height in meters squared. The harder number to get right is body fat percentage, because that's where most of the estimation error lives.
Common body fat estimation methods and their typical error ranges:
| Method | Typical Accuracy | FFMI Implication |
|---|---|---|
| DEXA scan | ±1–2% body fat | Most reliable FFMI source. Treat this as ground truth. |
| Hydrostatic weighing | ±1–2% body fat | Research-grade accuracy. Limited access. |
| AI photo estimation | ±2–4% body fat | Good for trend tracking. Single-session FFMI carries variance — track the trend. |
| BIA scale | ±3–5% body fat | Varies with hydration. Use only for week-over-week trends, not absolute FFMI. |
| Visual estimate | ±5–8% body fat | Too imprecise for meaningful FFMI calculation. |
The practical takeaway: any single FFMI data point carries measurement uncertainty. The chart above is most useful when you're tracking change over time — a rising FFMI across multiple consistent measurements is meaningful, regardless of which tier you're in.
How to Track FFMI Progress with the Muscle Map
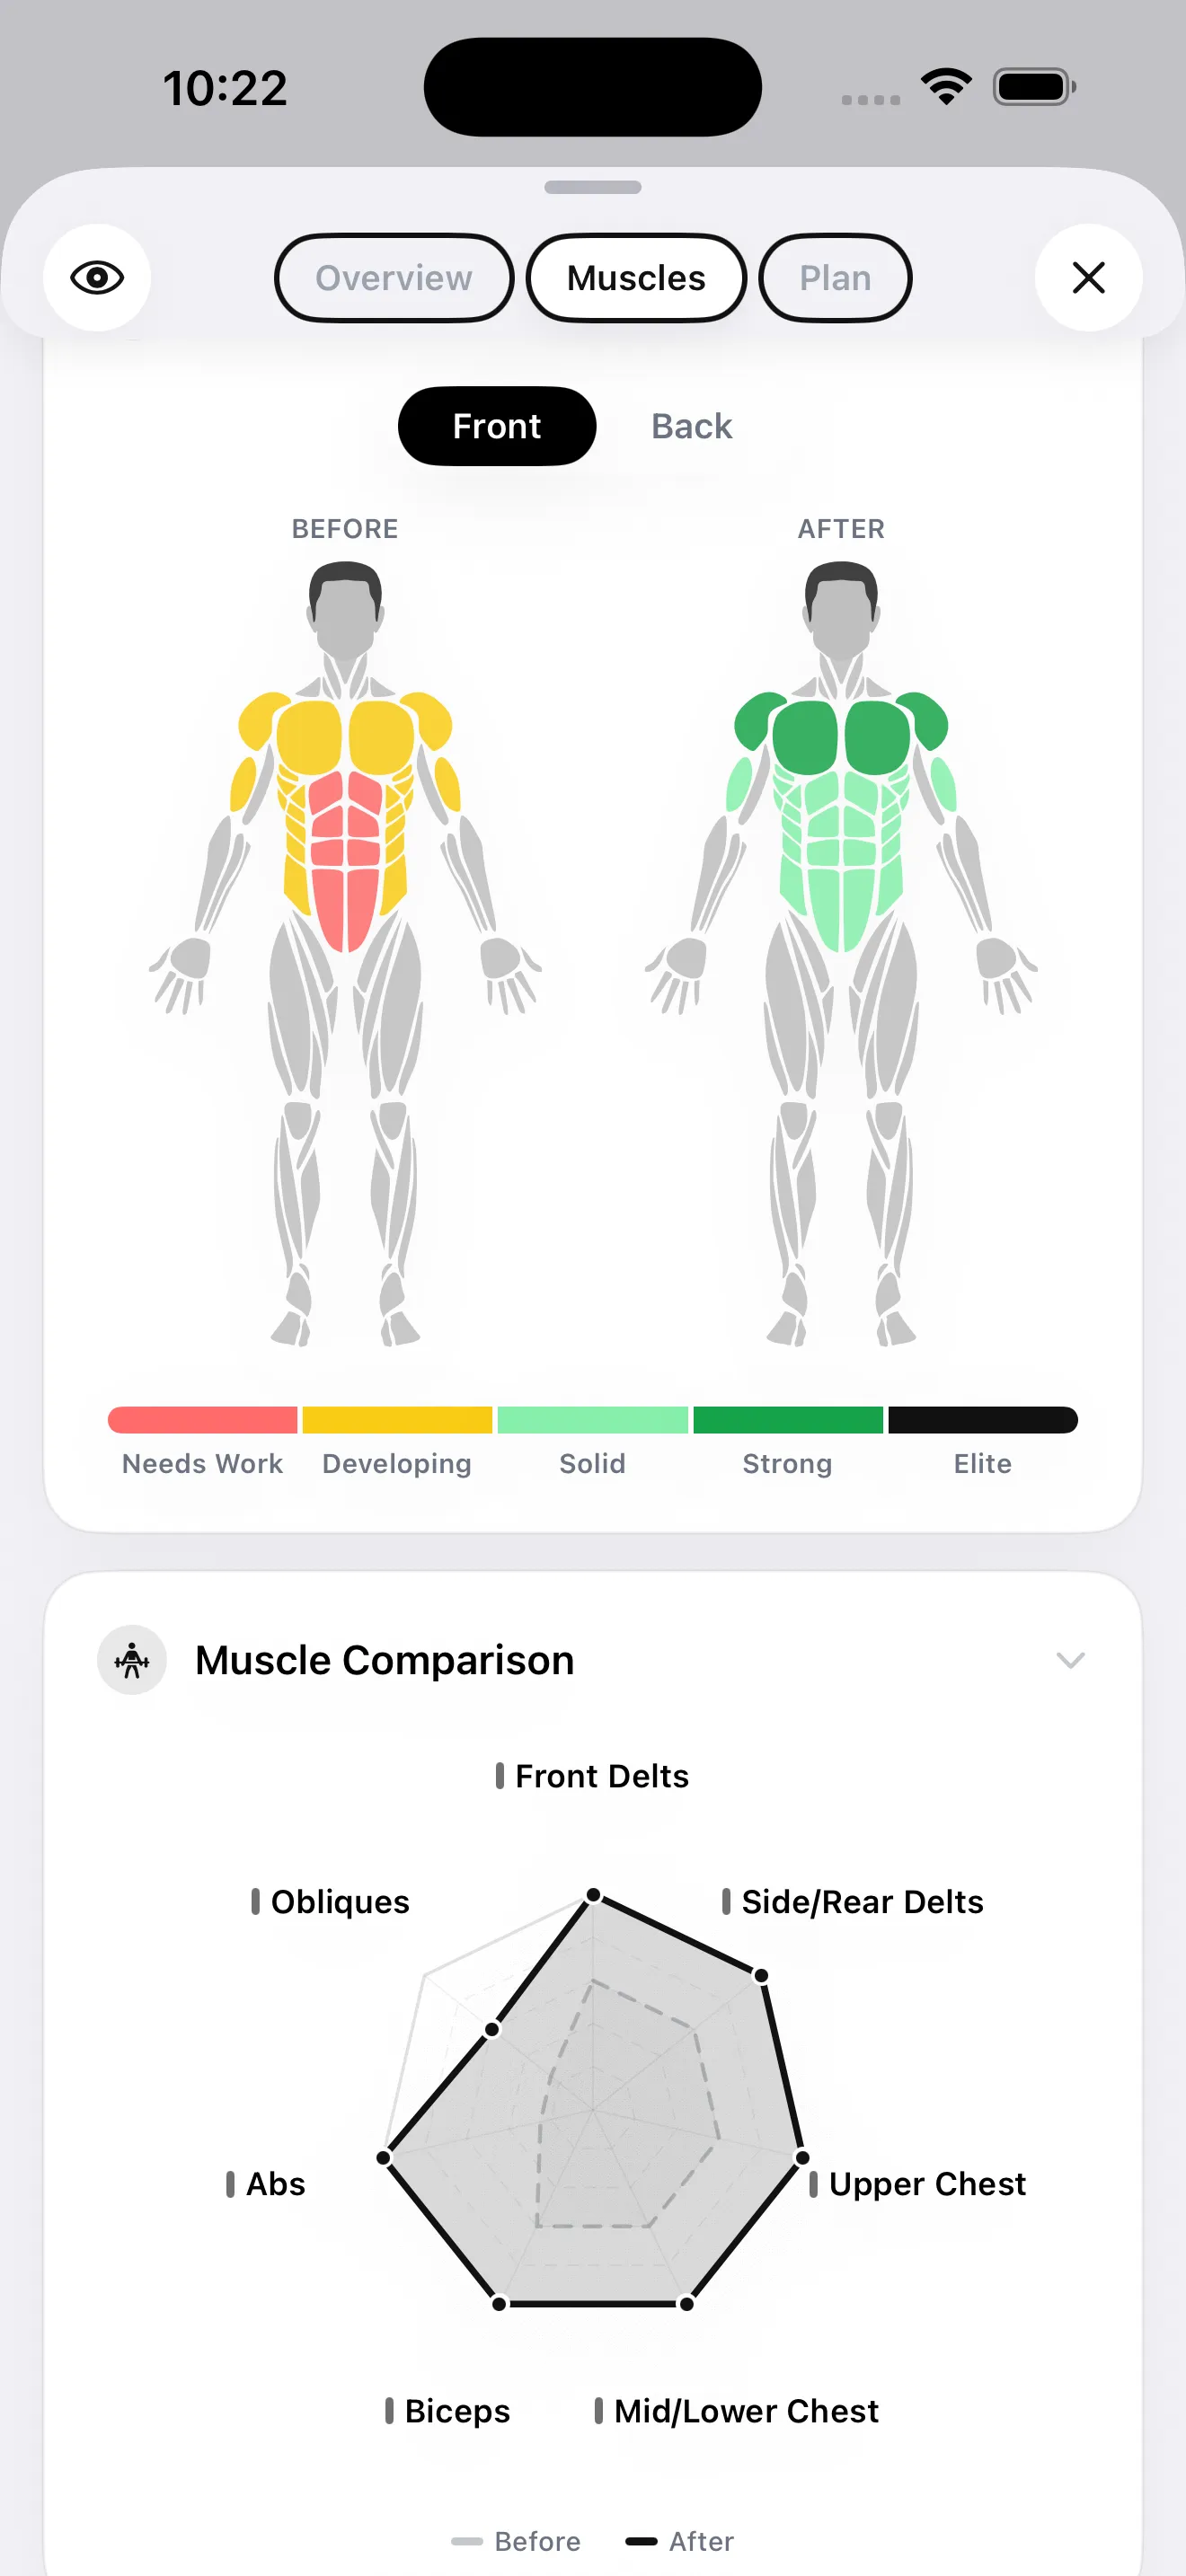
FFMI is a single aggregate number — it tells you how much lean mass you carry relative to your height but says nothing about where that mass is distributed. Two people at FFMI 22 can look radically different: one might have dense legs and a flat upper body; the other might have a wide upper back and underdeveloped lower body.
GainFrame's muscle map breaks the FFMI aggregate into 12 individual muscle group scores — Front Delts, Side/Rear Delts, Upper Chest, Mid/Lower Chest, Biceps, Abs, Obliques, and more — each rated on a Needs Work → Developing → Strong → Elite progression. This is where the chart becomes actionable: instead of just knowing your overall FFMI is 21, you can see that your upper back is Developing while your shoulders are Strong. The weak point is where the next increment of FFMI growth comes from.
How to Use This Chart as a Training Tool
- Find your current tier — then anchor to the tier above, not the ceiling. If you're at FFMI 20 (Above Average), your training goal is the behaviors that produce FFMI 22 (Excellent), not FFMI 25. The ceiling is a reference point, not a target. Moving one tier is a multi-year project.
- Check your body fat estimation method. If you're using BIA scales or visual estimates, your FFMI number carries significant variance. Upgrade to AI photo estimation or DEXA if you want to track FFMI meaningfully over time.
- Measure in 8–12 week blocks, not weekly. FFMI shifts slowly. Lean mass accrual of 1–2 lbs per month is strong progress — that produces an FFMI increase of roughly 0.2–0.4 per month. Measuring weekly is measuring noise.
- Pair aggregate FFMI with per-muscle scores. The chart tells you where you are overall. Per-muscle scoring tells you where to focus training to move the aggregate number upward most efficiently.