Your smart scale just gave you a visceral fat level of 8. Or 14. Or 3. And now you're looking at a number with no intuitive meaning — because unlike body weight, there's no lifetime reference point for what a visceral fat level of 11 is supposed to feel like.
This article explains what the number means, what's healthy, why it moves around, and how to actually lower it over time.
Where the Number Comes From
The visceral fat level on a smart scale is not a direct measurement of visceral fat. There is no technology in a consumer scale that can measure fat inside your abdominal cavity. What the scale measures is bioelectrical impedance (BIA) — a weak electrical current passes through your body and the resistance is used to estimate total body composition.
From that body composition estimate, the scale's algorithm derives a "visceral fat rating" using a proprietary formula that accounts for your total fat percentage, body weight, age, and sex. The result is a number on a scale — typically 1–59 for Tanita devices — that correlates with but does not directly measure visceral fat volume.
Tanita, which established the 1–59 scale, calibrated it against DEXA and CT scan data from population samples. The scale is not arbitrary, but it is an estimate, and the measurement error from BIA alone (±3–5% body fat) means your visceral fat level reading can shift by several points based on when you weigh yourself and how hydrated you are.
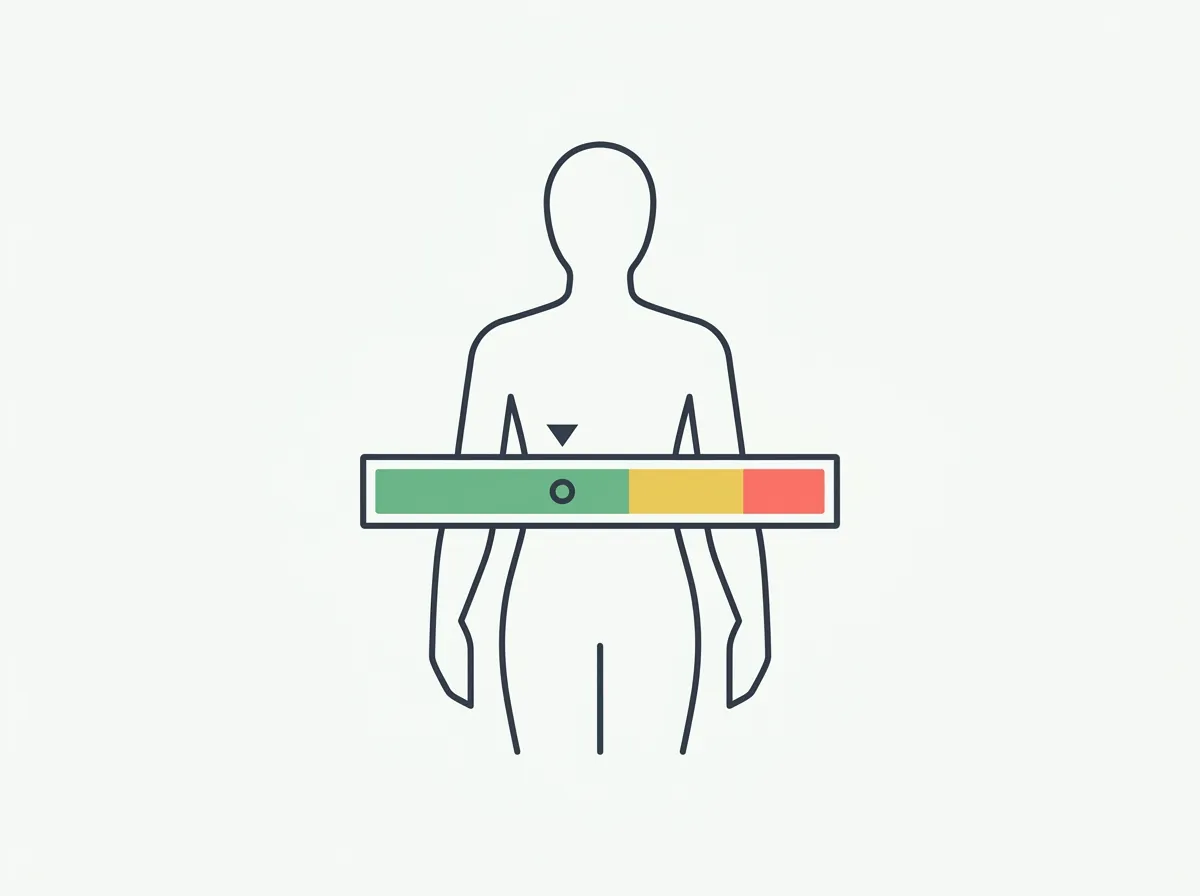
Visceral Fat Level Ranges: What Each Number Means
| LEVEL (TANITA SCALE) | CLASSIFICATION | WHAT IT MEANS |
|---|---|---|
| 1–6 | Healthy — low | Visceral fat accumulation is well below clinical thresholds. Common in lean, active individuals. |
| 7–12 | Healthy — moderate | Within normal range. Some visceral fat is metabolically necessary. No elevated health risk at this range. |
| 13–17 | High — borderline | Above healthy range. Associated with early metabolic risk markers. Actionable — responds well to diet and exercise. |
| 18–29 | High | Elevated visceral fat. Increased cardiovascular and metabolic risk. Meaningful intervention warranted. |
| 30–59 | Very high | Significantly elevated. Associated with substantially increased risk of type 2 diabetes, cardiovascular disease, and liver disease. |
These are Tanita's classifications. Other manufacturers use different scales — Withings Health Mate reports a 1–5 visceral fat index, and InBody devices report visceral fat area in cm² rather than a rated scale (normal is typically under 100 cm²). If your scale uses a different range, check the manufacturer's documentation for their specific thresholds.
Why Your Visceral Fat Level Fluctuates
BIA-based measurements are sensitive to factors that have nothing to do with actual fat mass. You can see your visceral fat level shift by 2–4 points day to day without any real change in body composition:
| FACTOR | DIRECTION OF EFFECT | MAGNITUDE |
|---|---|---|
| Dehydration | Raises reading (appears to have more fat) | Large — 2–4 levels |
| Eating before measurement | Raises reading | Moderate — 1–3 levels |
| Exercise before measurement | Raises reading (fluid redistribution) | Moderate — 1–2 levels |
| Alcohol (prior day) | Raises reading (dehydration effect) | Moderate |
| Well hydrated, morning, fasted | Most accurate reading | Baseline reference point |
This is why a jump of 2–3 levels in a single day is almost always noise, not signal. The level that matters is the 30-day rolling average, not any individual reading.
What a Healthy Visceral Fat Level Actually Looks Like
Some visceral fat is normal and necessary. It cushions and supports the abdominal organs. The question is how much — and whether your level is in the range where it starts creating metabolic problems.
Research correlating BIA-derived visceral fat levels with direct imaging (CT/MRI) suggests the following clinical picture:
| TANITA LEVEL | APPROXIMATE CT-MEASURED VISCERAL FAT AREA | CLINICAL CONTEXT |
|---|---|---|
| 1–5 | ~50–80 cm² | Below threshold for metabolic risk in most populations |
| 6–12 | ~80–130 cm² | Within normal range; 100 cm² is commonly used as the healthy ceiling |
| 13–20 | ~130–200 cm² | Above threshold; associated with elevated insulin resistance markers |
| 21+ | >200 cm² | Significantly elevated; strongly associated with metabolic syndrome components |
These are approximate mappings — the correlation between BIA-derived levels and CT measurements is meaningful at the population level but noisy for any individual. Use this as directional context, not a precise conversion.
How Visceral Fat Level Differs from Body Fat Percentage
These two numbers can tell different stories, and it is worth understanding why:
- Body fat percentage is the fraction of your total mass that is fat — subcutaneous plus visceral plus intramuscular. It reflects your overall composition.
- Visceral fat level is specifically about the intra-abdominal depot. Someone can have a relatively normal total body fat percentage and still carry disproportionate visceral fat — this is called "metabolically obese normal weight" (MONW) and it's more common in people who are sedentary despite being lean.
Conversely, a bodybuilder carrying 20% body fat might have a visceral fat level of 4–6 because their abdominal fat is predominantly subcutaneous, their insulin sensitivity is high, and their muscle mass absorbs glucose efficiently.
The level that matters for health risk is visceral, not total. Two people at 25% body fat can have meaningfully different visceral fat levels based on where they carry that fat.
How to Lower Your Visceral Fat Level
Visceral fat is the most metabolically responsive fat depot — it responds to caloric deficit and aerobic exercise faster than subcutaneous fat does. This is good news: of all the fat you carry, visceral fat is the most accessible to interventions.
A moderate deficit (300–500 calories/day) maintained for 12–24 weeks consistently reduces visceral fat in research populations, often before subcutaneous changes become visible. The visceral depot responds first.
Aerobic exercise has a specific effect on visceral fat independent of caloric deficit. Studies comparing diet-only vs diet-plus-exercise show greater visceral fat reduction in the exercise group even when total weight loss is matched. 150–300 minutes per week of moderate-intensity aerobic activity is the evidence-based target.
Resistance training improves insulin sensitivity and reduces visceral fat independent of weight loss in several RCTs. Adding 2–3 resistance sessions per week to the aerobic baseline compounds the effect.
Chronic sleep deprivation and elevated cortisol directly promote visceral fat accumulation via cortisol's effect on adipose tissue distribution. Seven to nine hours of sleep and managing chronic stress are not ancillary — they are direct levers on the visceral depot specifically.
Both drive visceral fat accumulation through insulin and liver fat pathways respectively. Reducing added sugars and alcohol has a disproportionate effect on visceral fat relative to subcutaneous fat.
Tracking Progress Beyond the Scale Number
Because visceral fat level readings fluctuate significantly with hydration and timing, it is worth cross-referencing with other signals that don't have the same noise problem:
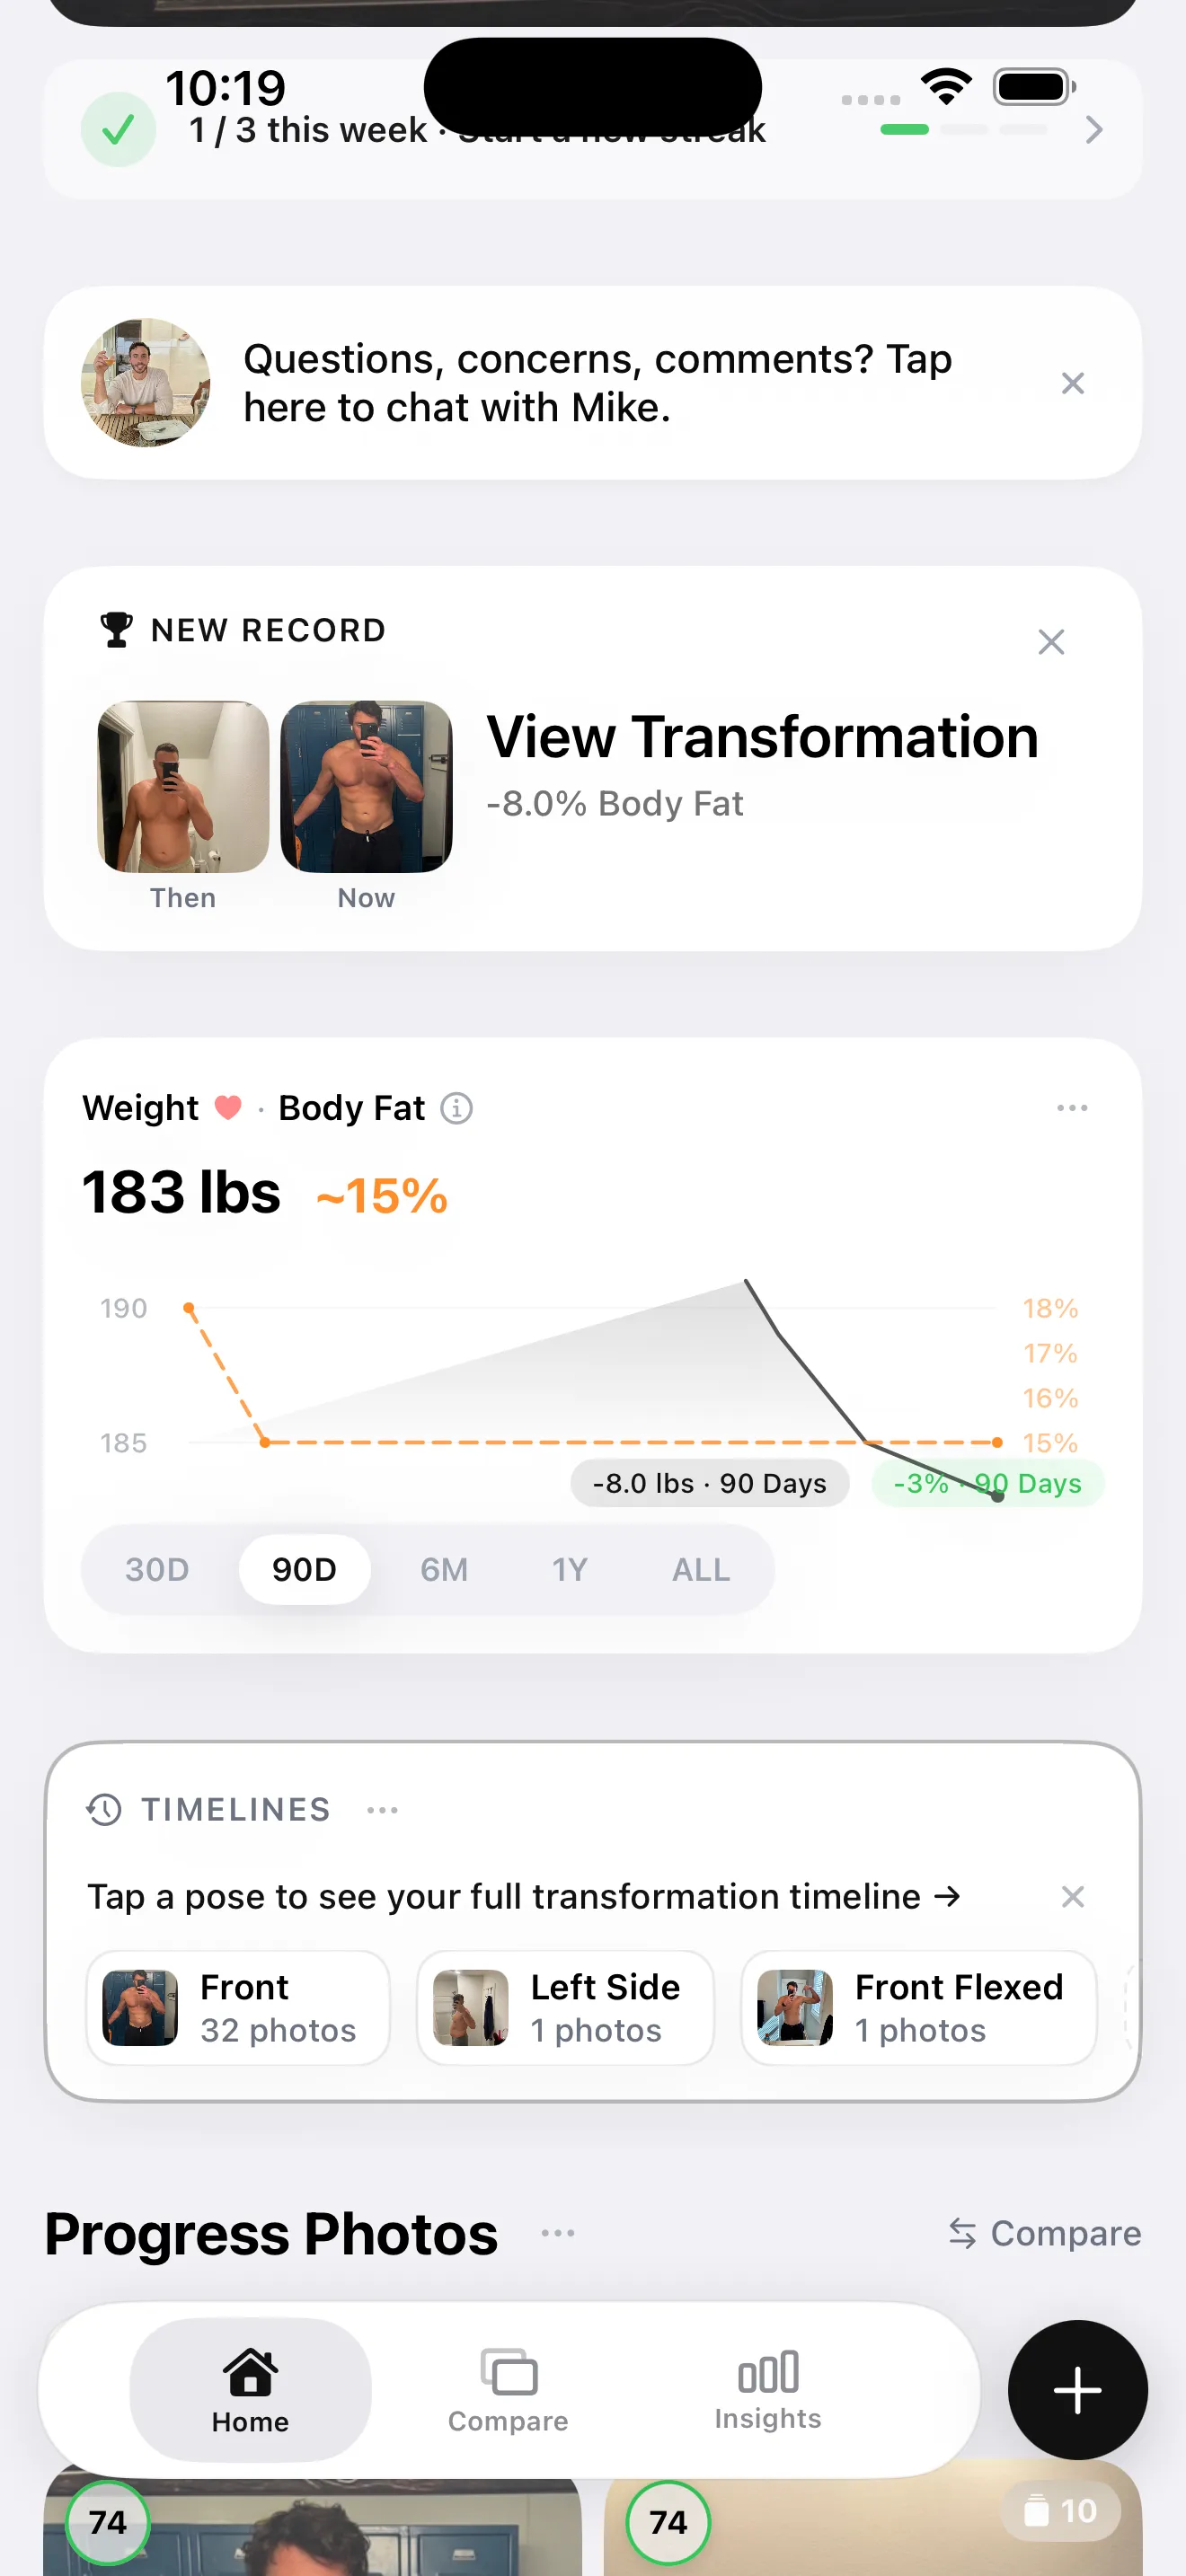
Body fat percentage trend from consistent progress photo check-ins captures the same underlying biology — overall fat reduction — without the day-to-day hydration noise that makes BIA readings jitter. When your BF% trend is consistently moving downward over months, your visceral fat level is following it.
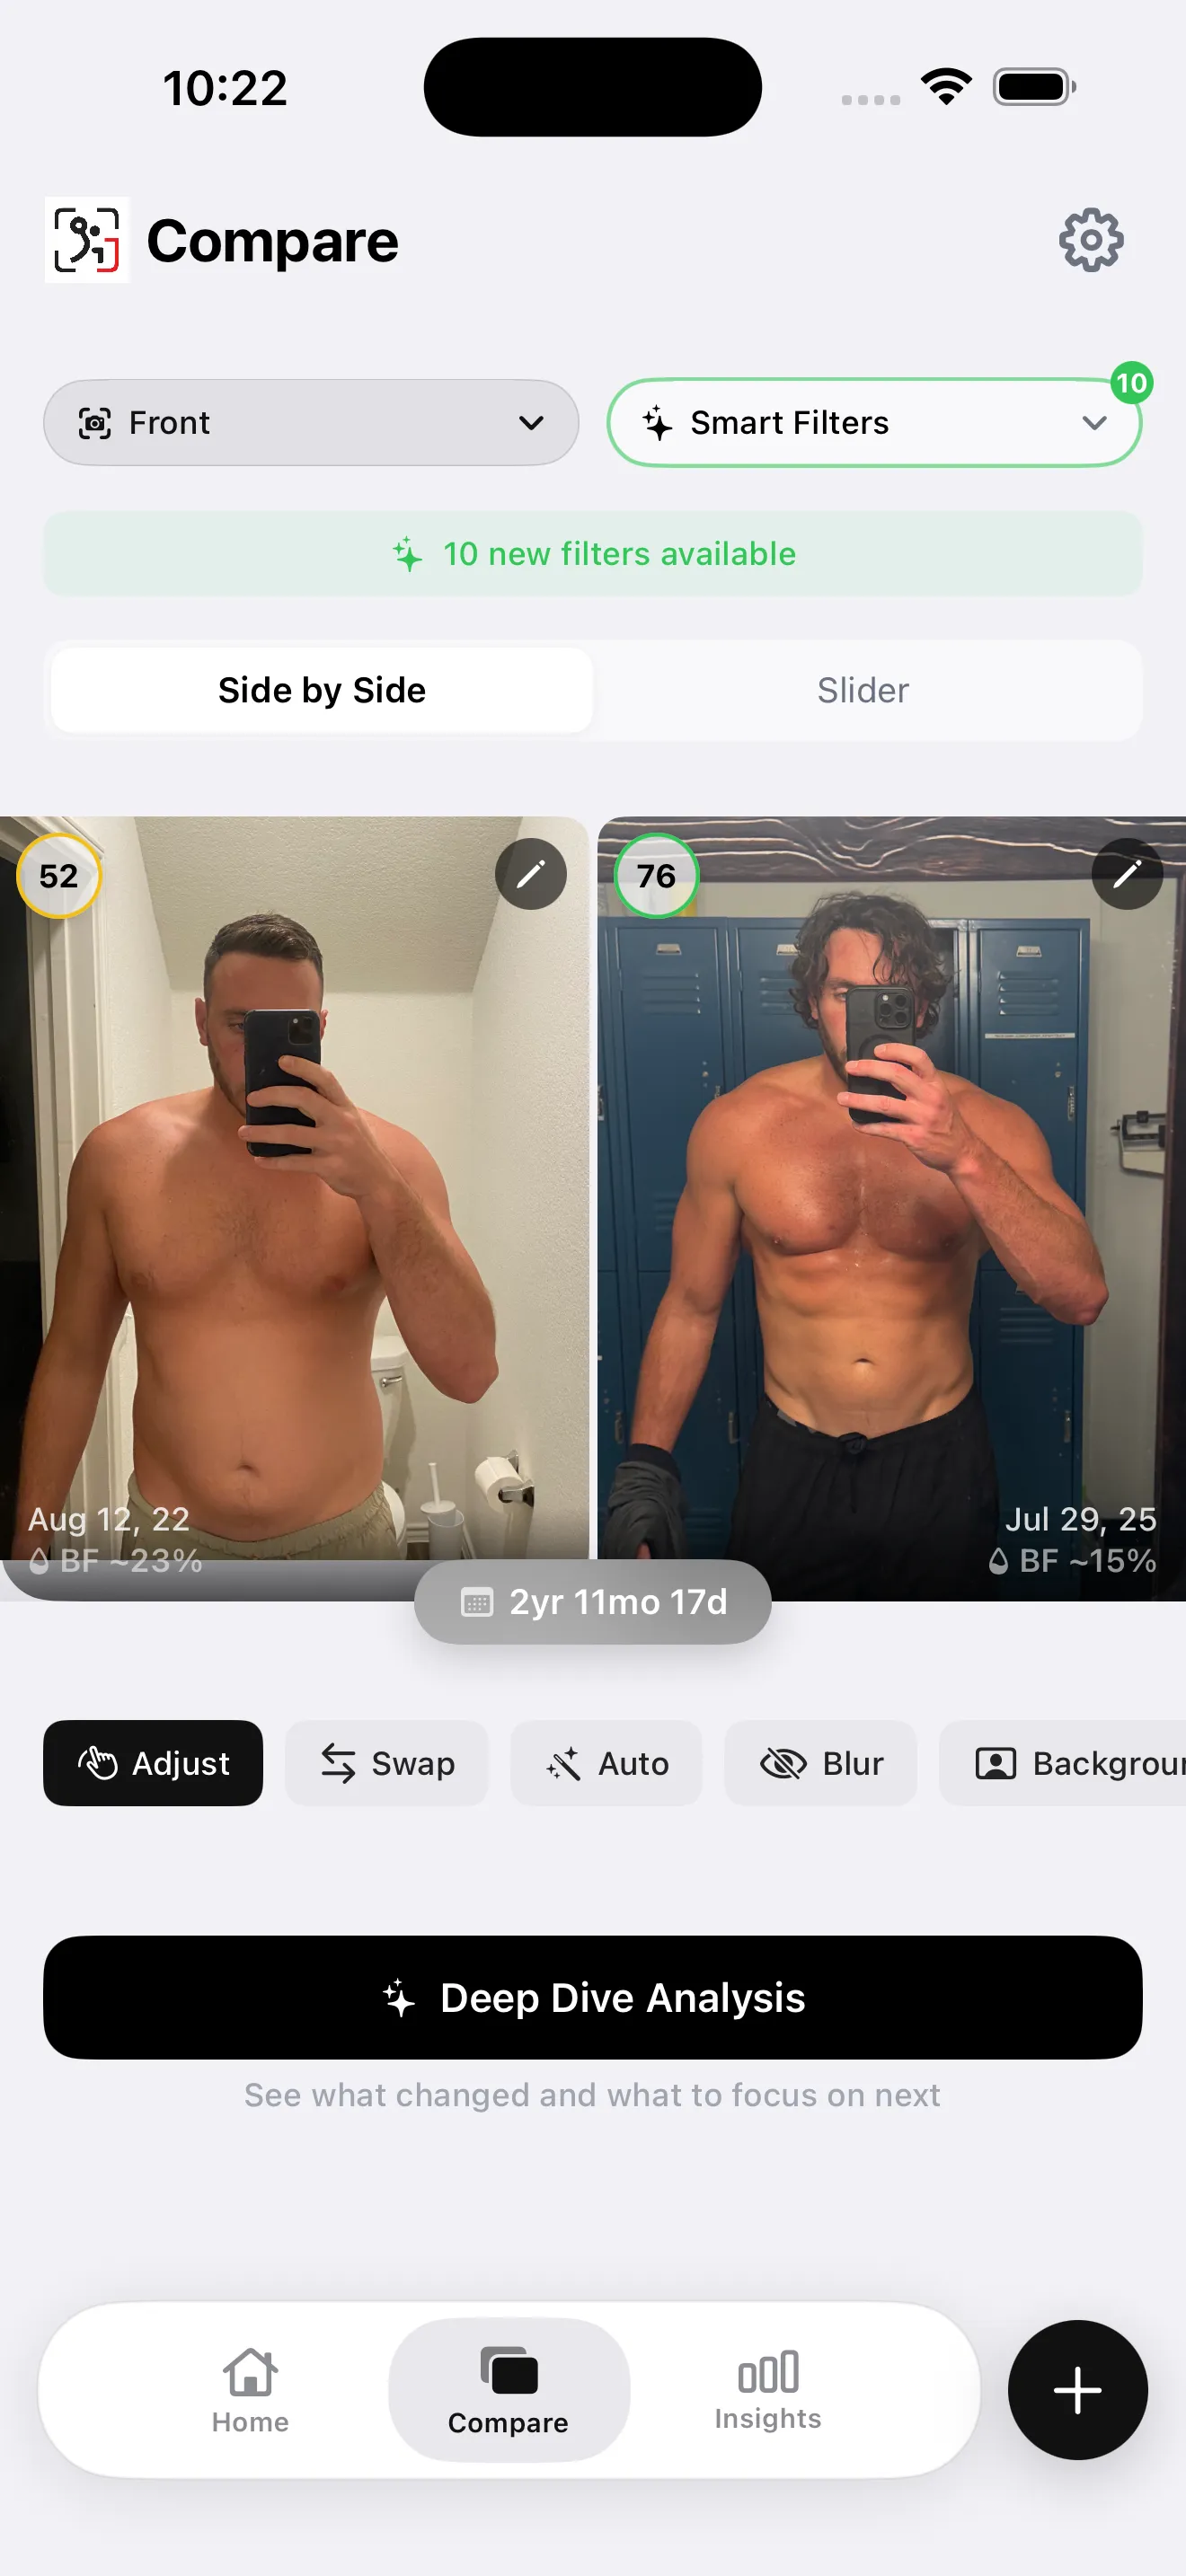
The comparison view shows what a real body composition shift looks like over 12–36 months. The visceral fat level at the end of a genuine transformation like this is typically in the 1–8 range — the level validates the visible change, even if it wasn't a number the person was tracking month to month.