
There is a meaningful difference between "tests that measure visceral fat" and "tests that estimate a proxy for visceral fat." Most of what gets marketed as visceral fat testing falls into the second category. This article covers both — what each test actually measures, how accurate it is, what it costs, and which situation it fits.
All Visceral Fat Tests, Ranked by Accuracy
| TEST | WHAT IT ACTUALLY MEASURES | VISCERAL FAT ACCURACY | COST | ACCESSIBLE? |
|---|---|---|---|---|
| CT scan | Visceral adipose tissue (VAT) area in cm² — direct cross-sectional imaging | Gold standard | $500–$2,000+ | Requires physician referral; radiation exposure |
| MRI | Direct visceral fat volume — no radiation | Gold standard (equivalent to CT) | $1,000–$3,000+ | Research and clinical settings; very limited consumer access |
| DEXA scan | Android fat mass (abdominal region) — best available proxy outside imaging | Strong proxy; correlates closely with CT-measured VAT | $50–$150 | Yes — BodySpec, DexaFit, and hospital outpatient |
| BIA smart scale | Derived visceral fat rating (1–59 or similar) — calculated from total body composition | Moderate proxy; heavily hydration-sensitive | $50–$200 (device cost) | Yes — home use |
| Waist circumference | Abdominal girth — AHA-validated surface proxy | Good trend tracker; population-validated thresholds | Free | Yes — tape measure |
| Waist-to-hip ratio | Fat distribution pattern (central vs peripheral) | Good for risk stratification; less useful for tracking small changes | Free | Yes — tape measure |
| AI photo body fat % | Overall body fat percentage from visual composition analysis | Indirect — BF% trend correlates with visceral fat changes | Low — subscription | Yes — smartphone |
The Gold Standard: CT Scan
A CT scan at the L4–L5 vertebral level (the research standard location) measures visceral adipose tissue area in cm² directly — the cross-sectional image separates subcutaneous fat from visceral fat with clear anatomical boundaries. This is the method used to calibrate and validate every other visceral fat estimation tool.
In research, a VAT area below 100 cm² at L4–L5 is generally considered normal. Above 130–150 cm² is associated with elevated metabolic risk in most study populations.
Why most people can't get one: CT scans require a physician referral, are not typically covered by insurance for body composition testing (as opposed to disease investigation), and deliver ionizing radiation — which makes repeated testing inadvisable. Cost runs $500 to $2,000+ out of pocket depending on facility and region. MRI is equivalent in accuracy but even more expensive and slower to obtain.
For most people monitoring visceral fat over time, CT is not the right tool. It is the reference standard — useful to know about, not practical to repeat quarterly.
The Best Accessible Test: DEXA Scan
DEXA (dual-energy X-ray absorptiometry) is the right answer for most people who want real data. It doesn't directly measure visceral fat — but it measures android fat mass, the fat in the abdominal region, which is the strongest proxy available without CT.
DEXA reports body composition segmentally: trunk, arms, legs, and android region (a defined abdominal area). The android fat mass measurement correlates strongly with CT-measured visceral fat across multiple validation studies. When android fat mass decreases on DEXA, visceral fat is almost certainly decreasing with it.
| DEXA METRIC | WHAT IT TELLS YOU |
|---|---|
| Android fat mass (kg) | Best visceral fat proxy DEXA provides. Track this number across scans. |
| Android fat % | Fat fraction of the android region. Useful for comparing across body weight changes. |
| Android-to-gynoid ratio | Fat distribution pattern. Higher ratio = more abdominal-dominant accumulation. |
| Trunk fat mass | Broader measure including chest and back. Less specific than android but useful context. |
| Visceral fat area (cm²) | Some DEXA machines report this directly — it is an estimate, not a CT-equivalent measurement, but useful as a trend marker. |
How to get a DEXA scan: Consumer DEXA services like BodySpec and DexaFit operate in most major US cities at $50–$150 per scan with no physician referral required. Hospital outpatient imaging departments also offer them, often for $100–$200. One scan every 6–12 months gives you clinical-grade benchmarks between which you track progress with other methods.
The Daily Tracker: BIA Smart Scale
BIA (bioelectrical impedance analysis) scales estimate body composition from how quickly a small electrical current passes through your body tissues. The visceral fat rating — typically a 1–59 scale on Tanita devices — is derived from the overall BIA measurement using a proprietary algorithm, not a separate direct measurement.
The core limitation is hydration sensitivity: BIA readings can shift 2–5 points based on whether you measured before or after drinking a liter of water, exercising, or eating. This makes single readings nearly useless for precise assessment. What BIA scales are genuinely good for is trend tracking — when you measure consistently (same conditions, same time of day, every morning fasted), the 30-day rolling average becomes a meaningful signal.
Tanita's 1–59 scale: levels 1–12 are healthy, 13–59 are high. Withings uses a 1–5 scale. InBody devices report visceral fat area in cm² (normal below 100). All three are estimates; none are diagnostics.
Best use case: Daily or weekly measurement as a trend indicator between DEXA benchmarks. Not suitable as a standalone assessment for clinical decisions.
The Free Test: Waist Circumference
Waist circumference is validated by the American Heart Association and WHO as a practical population-level visceral fat risk indicator. It is not a precise measurement of visceral fat volume — but it correlates with visceral fat accumulation reliably enough to be used in clinical risk assessment.
| THRESHOLD | MEN | WOMEN |
|---|---|---|
| Elevated risk (AHA) | >40 in / 102 cm | >35 in / 88 cm |
| High risk (IDF) | >43 in / 109 cm | >37 in / 94 cm |
How to measure: Stand relaxed, exhale normally, measure at the midpoint between the bottom of the lowest rib and the top of the hip bone — roughly at navel level or slightly above. Use a non-stretching tape. Do not suck in. Same time of day (morning, fasted) for every measurement.
Waist-to-hip ratio adds distribution context: divide waist circumference by hip circumference. Above 0.90 in men or 0.85 in women signals central (visceral-dominant) fat distribution.
Best use case: Monthly measurement as the primary free tracking tool. A waist measurement decreasing by 0.5–1 inch per month over 3–6 months is among the most reliable indicators of meaningful visceral fat reduction.
Which Test Is Right for Your Situation
| SITUATION | RECOMMENDED TEST | REASON |
|---|---|---|
| I need a definitive clinical number — doctor asked me to quantify visceral fat | CT scan via physician referral | Only method that directly measures VAT; required for clinical documentation |
| I want the most accurate accessible benchmark before a fat loss program | DEXA scan (BodySpec / DexaFit) | Android fat mass gives a strong visceral proxy at low cost; repeat every 6–12 months |
| I want to track monthly progress between DEXA scans | BIA scale + waist circumference | BIA trend + waist measurement corroborate each other and are sensitive to 4–8 week changes |
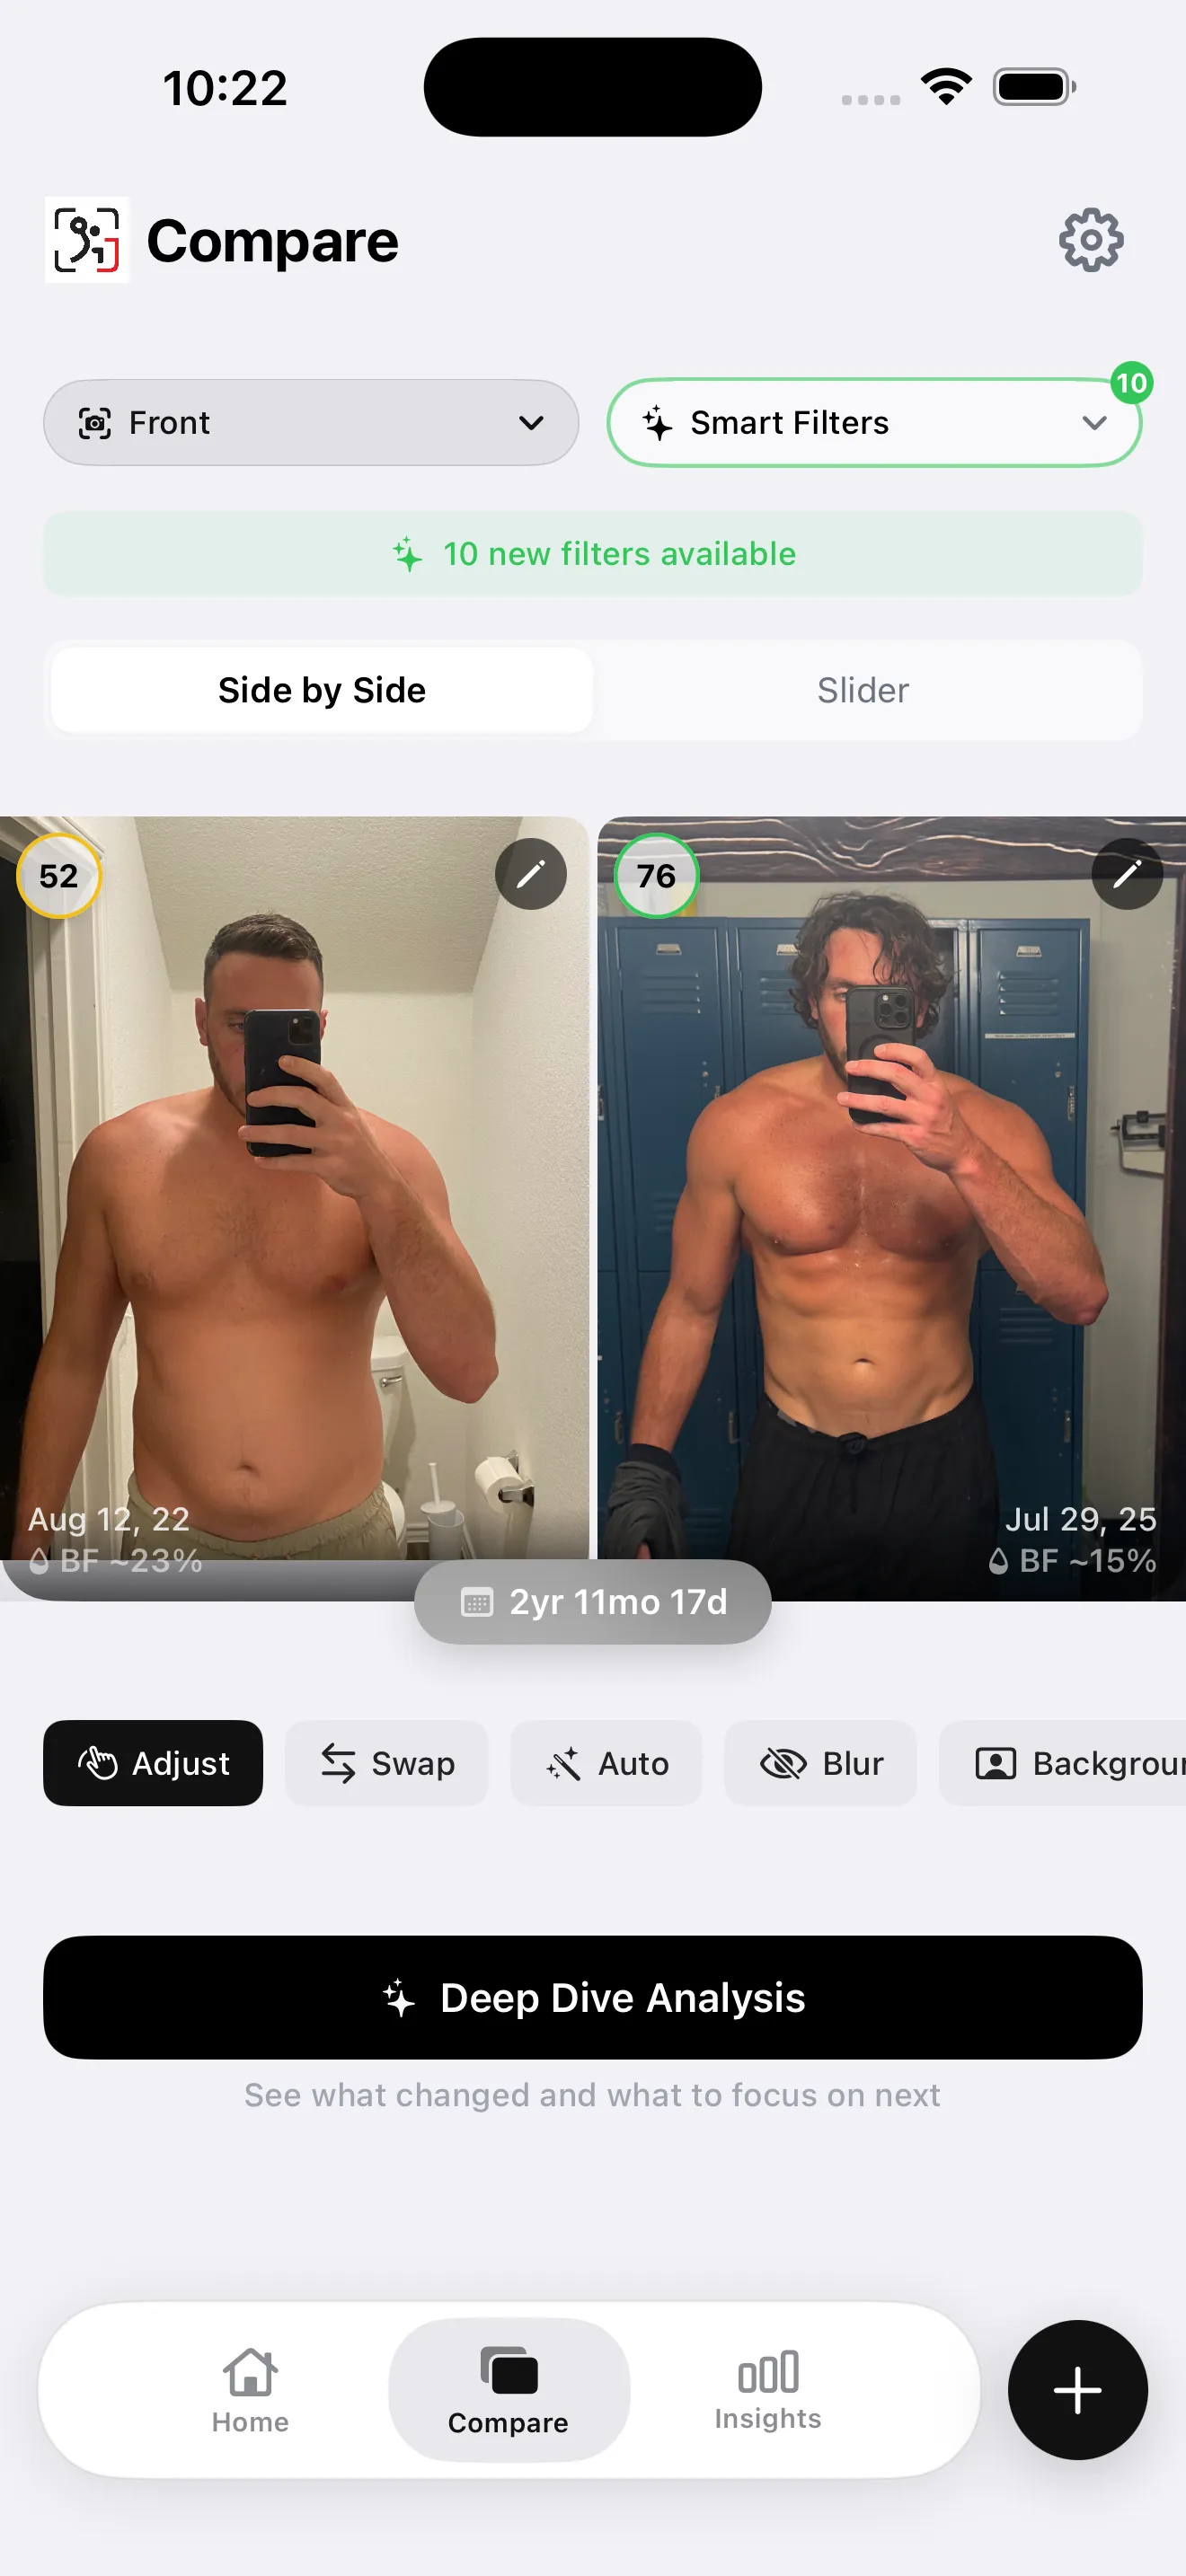
| I'm a lifter and want composition tracking alongside visual progress | AI photo app (GainFrame) + waist measurement | BF% trend from photos captures real composition change; waist adds the visceral-specific signal |
| I want the simplest possible data point for free | Waist circumference monthly | AHA-validated, free, and directly captures the dimension visceral fat affects most |
What No Test Can Tell You
Every test above gives you a number at a point in time. None of them tell you how fast visceral fat is changing — that requires comparing measurements over months. And none of them substitute for the lifestyle changes that actually reduce visceral fat: sustained caloric deficit, aerobic exercise, adequate sleep, and reduced processed carbohydrate and alcohol intake.
The test is useful for establishing a baseline and confirming progress. The work happens between tests.
Tracking Body Fat % as a Complement to Testing
Overall body fat percentage and visceral fat levels move together in the same direction. When you consistently reduce total body fat percentage over months, visceral fat is reducing — typically faster than subcutaneous, because visceral fat is more metabolically responsive.
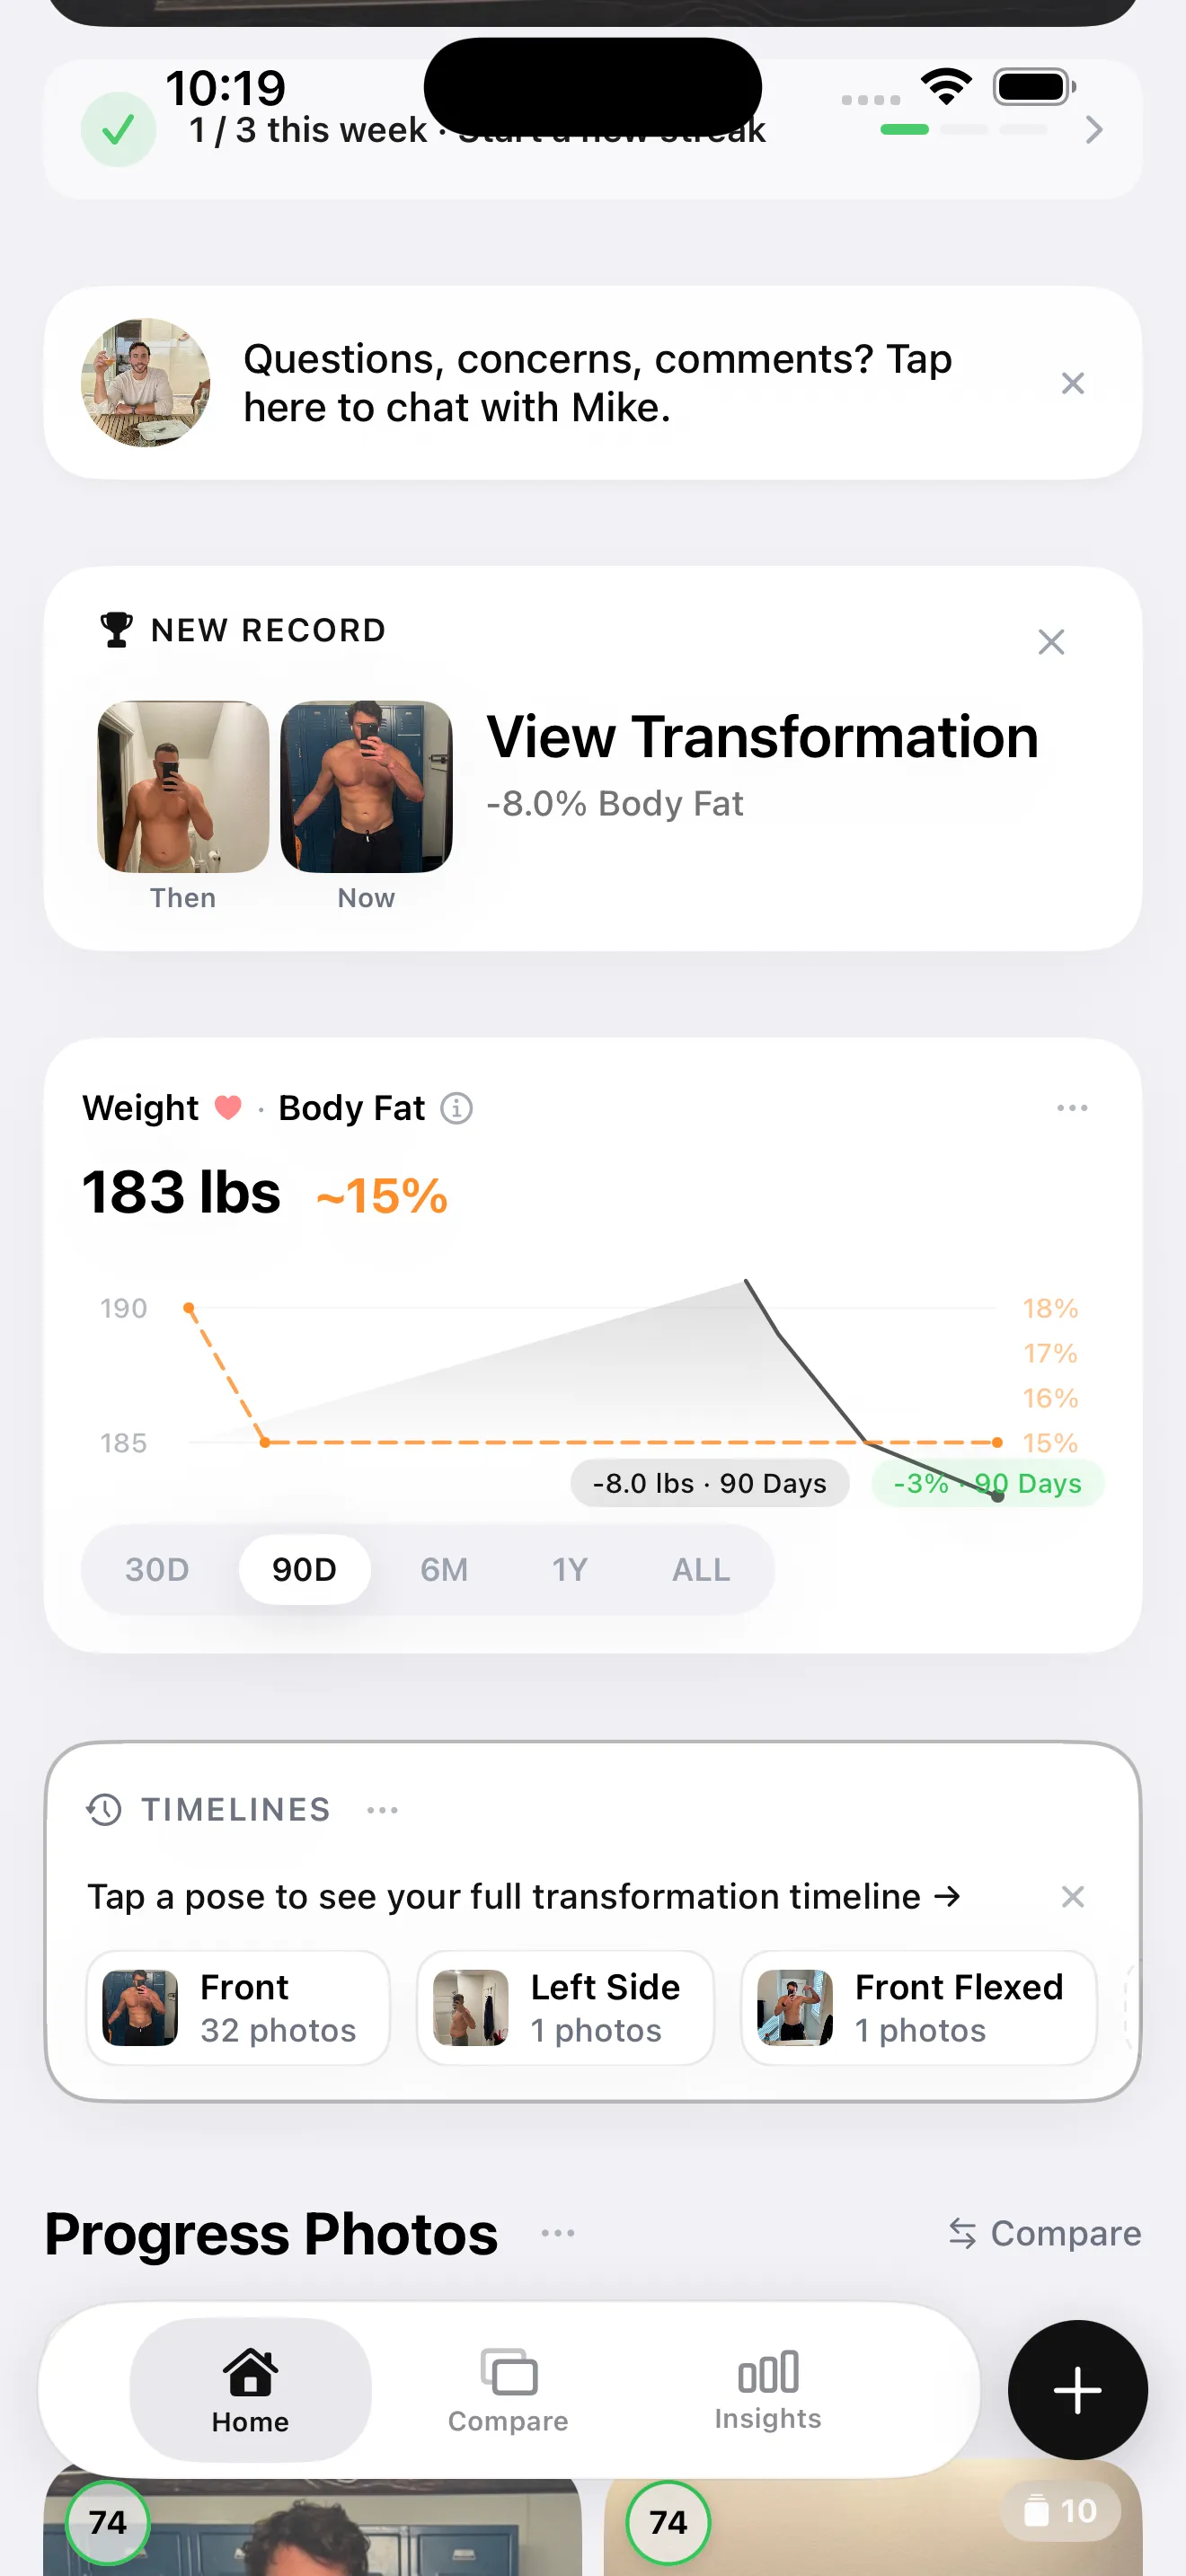
GainFrame tracks body fat percentage from consistent progress photos, giving you a trend line across months and years. Between DEXA benchmarks, this BF% trend is your best signal that the underlying biology is moving in the right direction — including the visceral depot.
Pairing consistent progress photos (BF% trend) with monthly waist circumference gives you two independent signals that don't share the same noise sources. BIA scale isn't affected by posture or tape placement; waist circumference isn't affected by hydration the way BIA is. Together they're more reliable than either alone.