Your smart scale told you 22% body fat this morning. Yesterday it said 18.9%. Neither number changed because your fat changed — your hydration did. Visual markers from a standardized photo are more stable than any impedance reading, and learning to read them yourself takes about ten minutes.
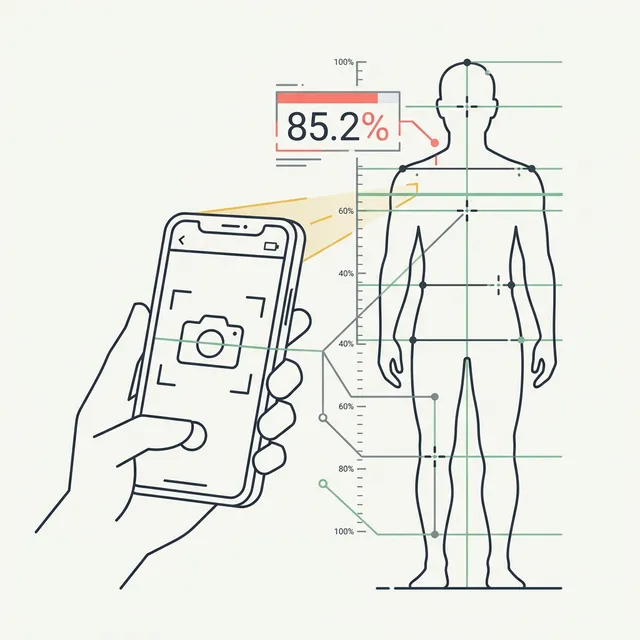
This guide covers exactly how to do that: what markers to look for, what body fat ranges they map to, and a six-step process you can apply to any progress photo. If you want to skip the manual work, our free AI body fat estimator reads a single photo and returns an estimate in about 30 seconds — no signup, one scan per day.
Why photos work for body fat estimation
Body fat percentage is not something you can feel on a scale or see in a mirror in real time. But subcutaneous fat — the fat that sits between your skin and muscle — does produce consistent, visible signals that cameras capture reliably.
The key advantage of photo-based estimation is that it measures what smart scales cannot: fat distribution rather than electrical conductivity. Bioelectrical impedance scales measure how fast an electrical signal travels through your body and infer fat from water content. One glass of water can swing a BIA reading 3–5 percentage points. A photo is unaffected by whether you just ate or how hydrated you are.
The honest limits: photos cannot see visceral fat (the fat around your organs that is metabolically dangerous), and lighting plus pose can make the same body look several percentage points leaner or heavier. Standardization is everything — more on that in step one.
A photo in harsh overhead light at 7am fasted will always look leaner than one taken after dinner under warm side lighting. Neither is lying — they just measure different things. Standardize to remove the variable.
Visual body fat % reference guide
These ranges are based on published norms from sports medicine and exercise science research. The markers listed are what physique coaches actually look for in check-in photos. Women carry 8–12 percentage points of additional essential fat for hormonal and reproductive function — apply the women's column accordingly.
| Body Fat % (Men) | Body Fat % (Women) | Abs visible | Vascularity | Muscle separation | Overall look |
|---|---|---|---|---|---|
| ~5% | ~13% | Deep cuts + striations at rest | Veins on abs, chest, quads | Full striations in muscle bellies | Competition-stage lean; unsustainable |
| ~10% | ~18% | Clear 6-pack at rest | Prominent forearm + bicep veins | Visible in all major groups | Very lean; athletic |
| 12–14% | 20–22% | Upper abs at rest; lower abs under flex | Forearm veins at rest | Clear deltoid/bicep/quad separation | Lean, defined; common goal physique |
| 15–17% | 23–25% | Outline visible; definition soft | Veins visible under pump | Visible under flex; softens at rest | Average-fit; some softness in midsection |
| 20–25% | 28–33% | No visible definition at rest | Minimal or none | Not visible at rest | Healthy average; noticeable midsection |
| 25–30% | 33–38% | None | None | None | Soft throughout; waistline loss of taper |
| 30%+ | 38%+ | None | None | None | Significant fat accumulation at midsection and limbs |
Use this table to bracket yourself, not to hit a single number. Multiple markers pointing to the same range gives you a credible 3–5% window — which is more useful than false precision from a single measurement.
Step-by-step: how to read body fat from your own photo
This is the process physique coaches use for weekly check-in photos. You can apply it to any standardized photo you take today.
- Step 1: Take a standardized photo. Shoot in natural light (window light works, avoid overhead bulbs), morning, unfed, with your phone on a surface at waist height — not held up or down. Stand 5–6 feet away. Shoot front, side, and back. Wear shorts only; compression garments distort the visual significantly. This step is the one most people skip, and it is the most important: without consistent conditions, your comparison data is meaningless.
- Step 2: Check abdominal definition. Abs are the most reliable body fat marker. Look at your midsection relaxed, not flexed. Can you see any outline? Individual separations between the rectus abdominis segments? Deep cuts? Use the reference table above: if you see nothing at rest, you are likely 17%+. Upper abs visible but lower soft: 13–17%. Full 6-pack at rest: 10–13%. Deep cuts with visible texture: sub-10%.
- Step 3: Assess vascularity. Look at your forearms and biceps in the photo. Are veins visible at rest? Forearm vascularity at rest typically appears in the 12–15% range for men; bicep and shoulder veins indicate lower. Vascularity varies by genetics and temperature — it is a supporting cue, not a standalone number. If you have visible forearm veins at rest, it confirms you are on the leaner side of your bracket.
- Step 4: Look at muscle separation and striations. Examine the boundary between your deltoid and bicep. Between your quad heads. Between pec and front delt. Can you see clear demarcation lines? Visible separation at rest (not just under flex) indicates approximately 12–15% for men. Striations — visible texture inside a single muscle belly — indicate sub-10%. For women, shift these thresholds by 8–10 points.
- Step 5: Use the reference table to bracket yourself. Take the readings from steps 2–4 and find the row in the table above that best matches all three markers simultaneously. If abs say 15–17% and vascularity says 12–15%, land in the overlap: roughly 15%. The goal is a 3–5% window, not a single percentage point. Do not try to narrow it further from a photo — even DEXA has a ±1–2% margin of error.
- Step 6: Cross-reference with AI — or skip steps 1–5 entirely. Upload your standardized photo to GainFrame. The AI reads abdominal definition, vascularity, muscle separation, overall fat distribution, and body shape simultaneously and returns a body fat estimate calibrated against DEXA scan reference data. It does what the five steps above do, in about 30 seconds, without the subjectivity. The estimate is most accurate when your photo is standardized (step 1 still matters), but the analysis replaces the manual assessment work entirely.
What photos cannot tell you
There is one category of fat that no photo can reach: visceral fat. Visceral fat accumulates inside the abdominal cavity, wrapping around your organs. It is metabolically dangerous — associated with insulin resistance, cardiovascular risk, and inflammation — and it is completely invisible in a progress photo.
Someone can look lean in a photo and still carry significant visceral fat if their subcutaneous fat is low but their visceral fat is elevated. The reverse also happens: a visibly soft midsection may be primarily subcutaneous, with low visceral fat and minimal metabolic risk. A photo tells you about subcutaneous fat distribution. It says nothing about what is happening deeper in the abdominal cavity.
If visceral fat is your concern — especially if you carry fat primarily in the midsection — that requires actual measurement: DEXA, MRI, or clinical visceral fat estimation tools. A progress photo is not the right instrument for that question. For a full breakdown of the difference, see Visceral Fat vs Subcutaneous Fat.
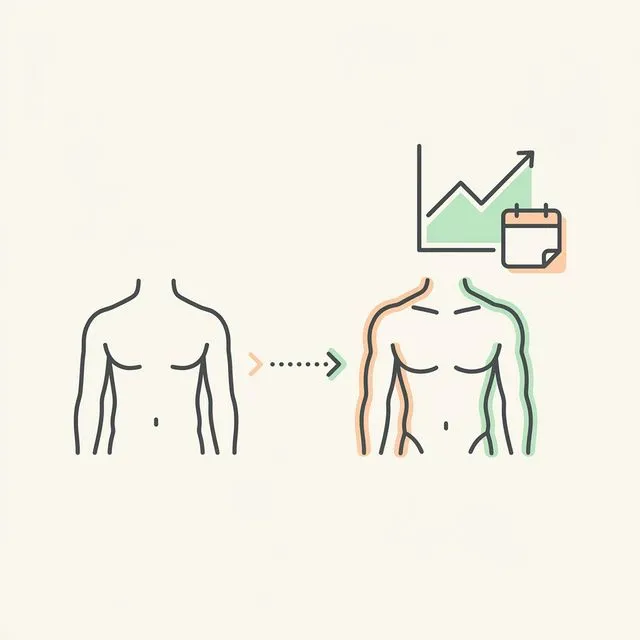
The other honest caveat: body fat estimates from photos carry more variance than DEXA on any single measurement. The number you get from a photo — yours or AI-generated — is an estimate within a range. What matters more than the absolute number is the trend across consistent check-ins. A body fat estimate moving from 22% to 18% over 12 weeks, measured under identical conditions, is real signal. A single snapshot number is not.
Let AI read the markers for you.
GainFrame reads abdominal definition, vascularity, and muscle separation simultaneously and gives you a body fat estimate validated against DEXA scan data. One photo. 30 seconds.
Download GainFrame — Free on iOS